How does the current day fit into the longer-term picture? Answer this question and you will know the context of the current move. In Part 1 of this article, I focused on the longer-term picture and now it is time to zero in on what I thought was going to happen today.
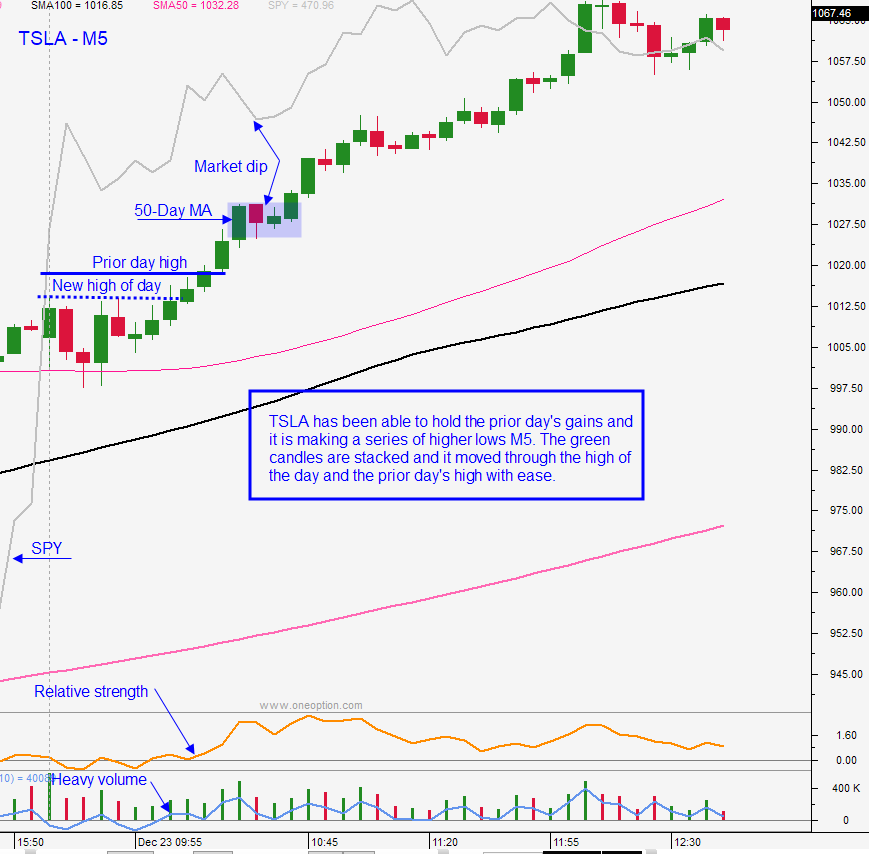
I post my pre-open market comments each morning (free) and I referenced the tendency for the market to rally hard off of the 50-day MA. Earnings season is heating up and that typically provides a very strong market bid. I did NOT jump on the first print. I prudently waited for the price action to confirm what I believed was the most likely scenario. If it played out I planned to “size up” (I traded 3X my normal size) and I planned to ride the moves as long as possible. It was critically important not to get trapped in a gap reversal. Here is how the day progressed and you can reference the numbers on the chart.
- The market gapped higher and the first bar had a decent range. The gains held for the first two bars and that was a sign that buyers are overpowering profit takers. If the SPY could take out the prior day’s high on the first shot with a long green candle it would be a sign that the market bid was strong and I would not hesitate to buy.
- Two long green candles stacked with very little overlap blew through the prior day’s high and now we are set to fill in some of the gap from Monday. My entry was good and now I want/expect all of the gains from the second candle to hold. The doji is fine since it is at the top of the second green candle and now I am expecting another long green candle. When I get that candle I know that this has been a large move for the SPY and I want to gauge any retracement.
- We get a tiny retracement and the halfway point of the most recent long green candle is preserved (that would have been my stop if it was breached). Remember, I was expecting a strong day and I wanted to stick with the position as long as possible. The dip only lasted two bars and then we got another long green candle. This is an extremely powerful move.
- I had big gains and I took profits with the intention of re-entering. I knew that after a strong move like this the dips would be brief. The long red candle was a “one-off” and it was followed by two dojis that traded below the close of the red bar. They were followed by a green candle that almost recovered the red bar and I bought futures.
- The tiny bodied candles here told me that resistance was building and I took gains. This is also when I recorded a daily video so I wanted to be flat. I don’t like to have futures positions on when I am recording.
- The tiny bodied candles are a sign of resistance and there is an indicator that is telling me to be very careful. You can see the giant red bar and I consider this to be a key bar. It tells me that there is selling pressure at that level. If buyers were still super aggressive there would never have been a long red bar like that because their buy orders at lower levels would have gobbled up all of that sell order. You can see how the open from that red bar was very close to the high of the day.
- This is a classic set up and it really drives home the concept of context. After such a massive rally most indicators are way overbought. Traders are always looking for big reversals and that red candle got everyone excited to short. The market can’t recover and it compresses. In time the lower end of the compression is breached and this is when shorts get really excited because it looks like the market is ready to roll over. This is a classic trap. Remember the initial context of the day was for a big rally that closes near the high of the day. To this point we had all of the patterns that suggest massive buying. We had stacked green candles with little or no overlap, tiny little dips that only lasted a few bars. Did those buyers all of a sudden disappear? No. That small drop through the lower end of the compression lured in shorts. The buyers were back and they slammed the door in their face. I bought right at the arrow and I knew we were going higher because those shorts were about to get squeezed. I took gains when I saw the tiny bodied candles. That was a sign of resistance near the high of the day so it was prudent to take those gains.
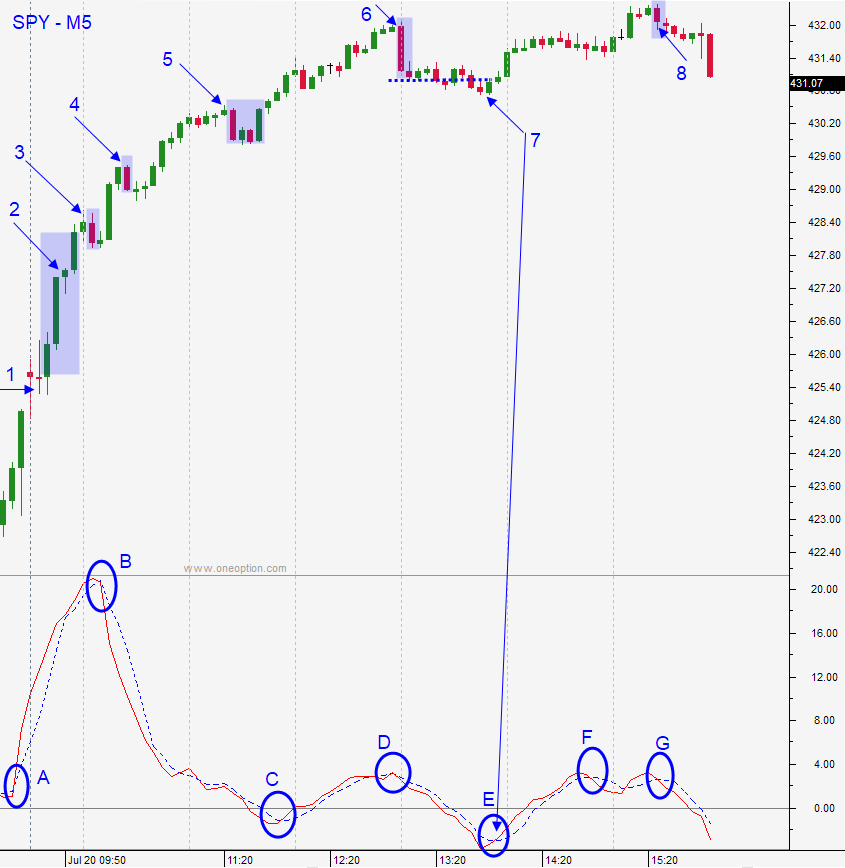
A. I use a proprietary indicator to trade S&P 500. If you feel I am going to sell you some crap, stop reading now. If you are interested in how it works, keep reading. It is optimized for the SPY for a 5-minute interval. It is predictive and consequently, it is early. That means it needs technical price confirmation. From the opening bell it was on a buy signal.
B. When the indicator spikes and the red line crosses below the blue line, it generates a sell signal. Typically, the market goes down when this happens, but price confirmation is needed. The market never rolled over (half of the green candle referenced above was preserved) so you would never have taken the short. In fact, when the indicator is falling and the market is rising there is a bullish divergence. This indicates that there is an incredibly strong trend that you can ride. We only see these divergences about 20% of the time and the candles to this point told us to watch for a divergence.
C. When the indicator falls below zero and the red line crosses the blue line it generates a buy signal. This means that you can continue to ride the momentum and as you can see the market staged another leg higher.
D. Notice how the red line crossed the blue line well before the long red bar appeared. This is a bearish cross and the tiny bodied candles near the high of the day were a sign that there was resistance. You could have taken that short after the red candle but after a bullish divergence and a massive rally you should be extremely cautious on the short side (trade smaller size and use tighter stops).
E. This is a typical bullish cross and it was where I bought the futures. This was the setup I reference in #7 above.
F. The last two bearish signals would have panned out, but I did not trade them. It was getting late in the day.
My reason for posting such detail on the S&P 500 is that it dictates all of your trading. It is important to put the current move into long-term and short-term context. Many traders are tempted to trade the S&P 500. It is super liquid and the leverage is incredible. Unfortunately, it is one of the hardest instruments to trade and there are only certain days when you should trade it. The good news is that there is a much better alternative to trading S&P 500 and I will discuss it in a future article.
Trade well