In this option trading blog, no consideration has been given to your suitability for this trade. It is intended for educational purposes only.
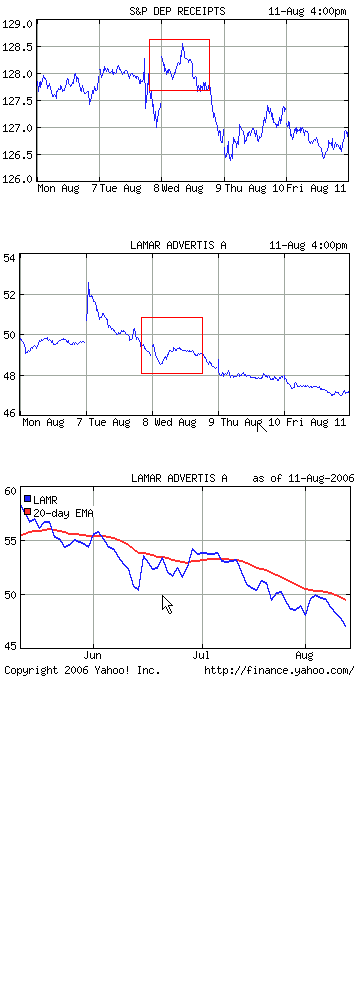
1. First you have to get a feel for what the SPY has been doing. For the last 5-days, it has been relatively flat with a $.50 change for the week.
2. This is a 5-day chart of LAMR. Notice how it gapped up 4-days ago and it has been drifting lower all week. In fact, that day it had an intraday reversal and closed down for the day. Look at what the stock did the next day. Reference the two red boxes. The market gapped higher and the stock could barely rally. By the end of the day, the market was unchanged and the stock was down. Then, Friday the market was flat and the stock declined steadily to finish near its low of the day.
3. In the last chart the relative weakness is obvious. This stock is in a very orderly down trend. It has not been able to poke above the 20-Day EMA. The company posted weak earnings Tuesday – hence the gap and reversal. This stock had EPS of $.18 and analysts expect it to make $.52 this year. With revenue growth of 8% and a forward P/E over 90, this looks like a short.
Be prudent. This stock appeared in the Daily ReportThursday.