Release Notes
April 2024
The following small improvements to Option Stalker Pro are included in this interim update. Click the links below to view screenshots of the feature in OSP.
New Features
Updates
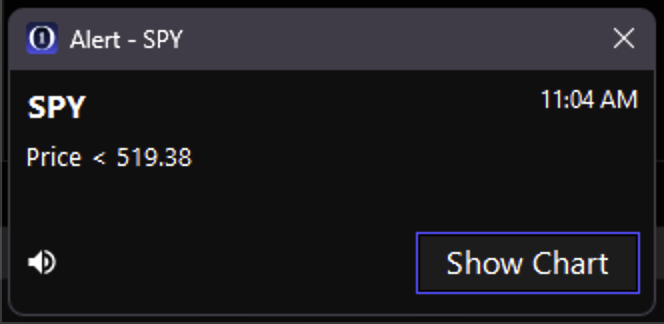
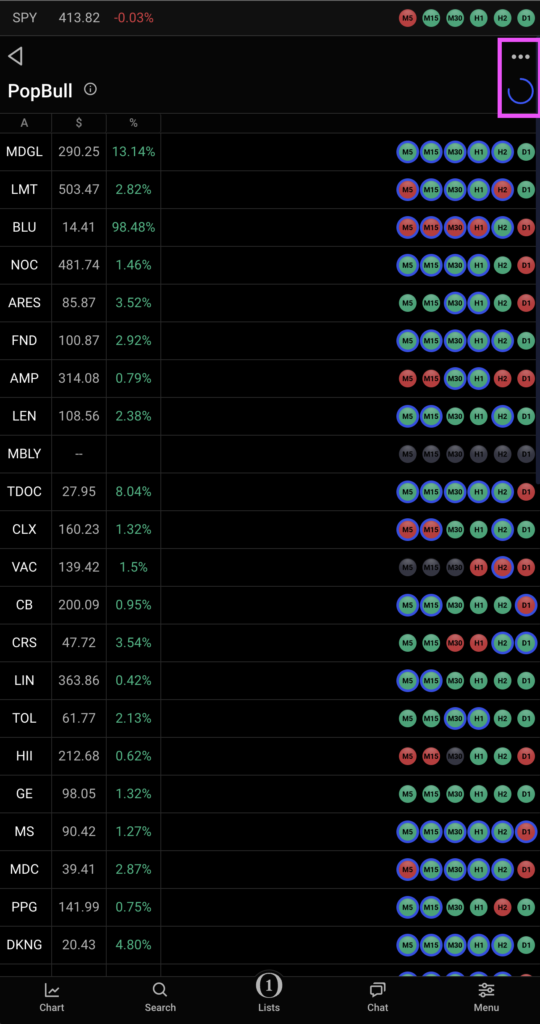
- New Alert Popup Design – The Alert Popup design has been improved to include the stock symbol in the window header, the trigger time, and reordered for legibility and ease-of-use.
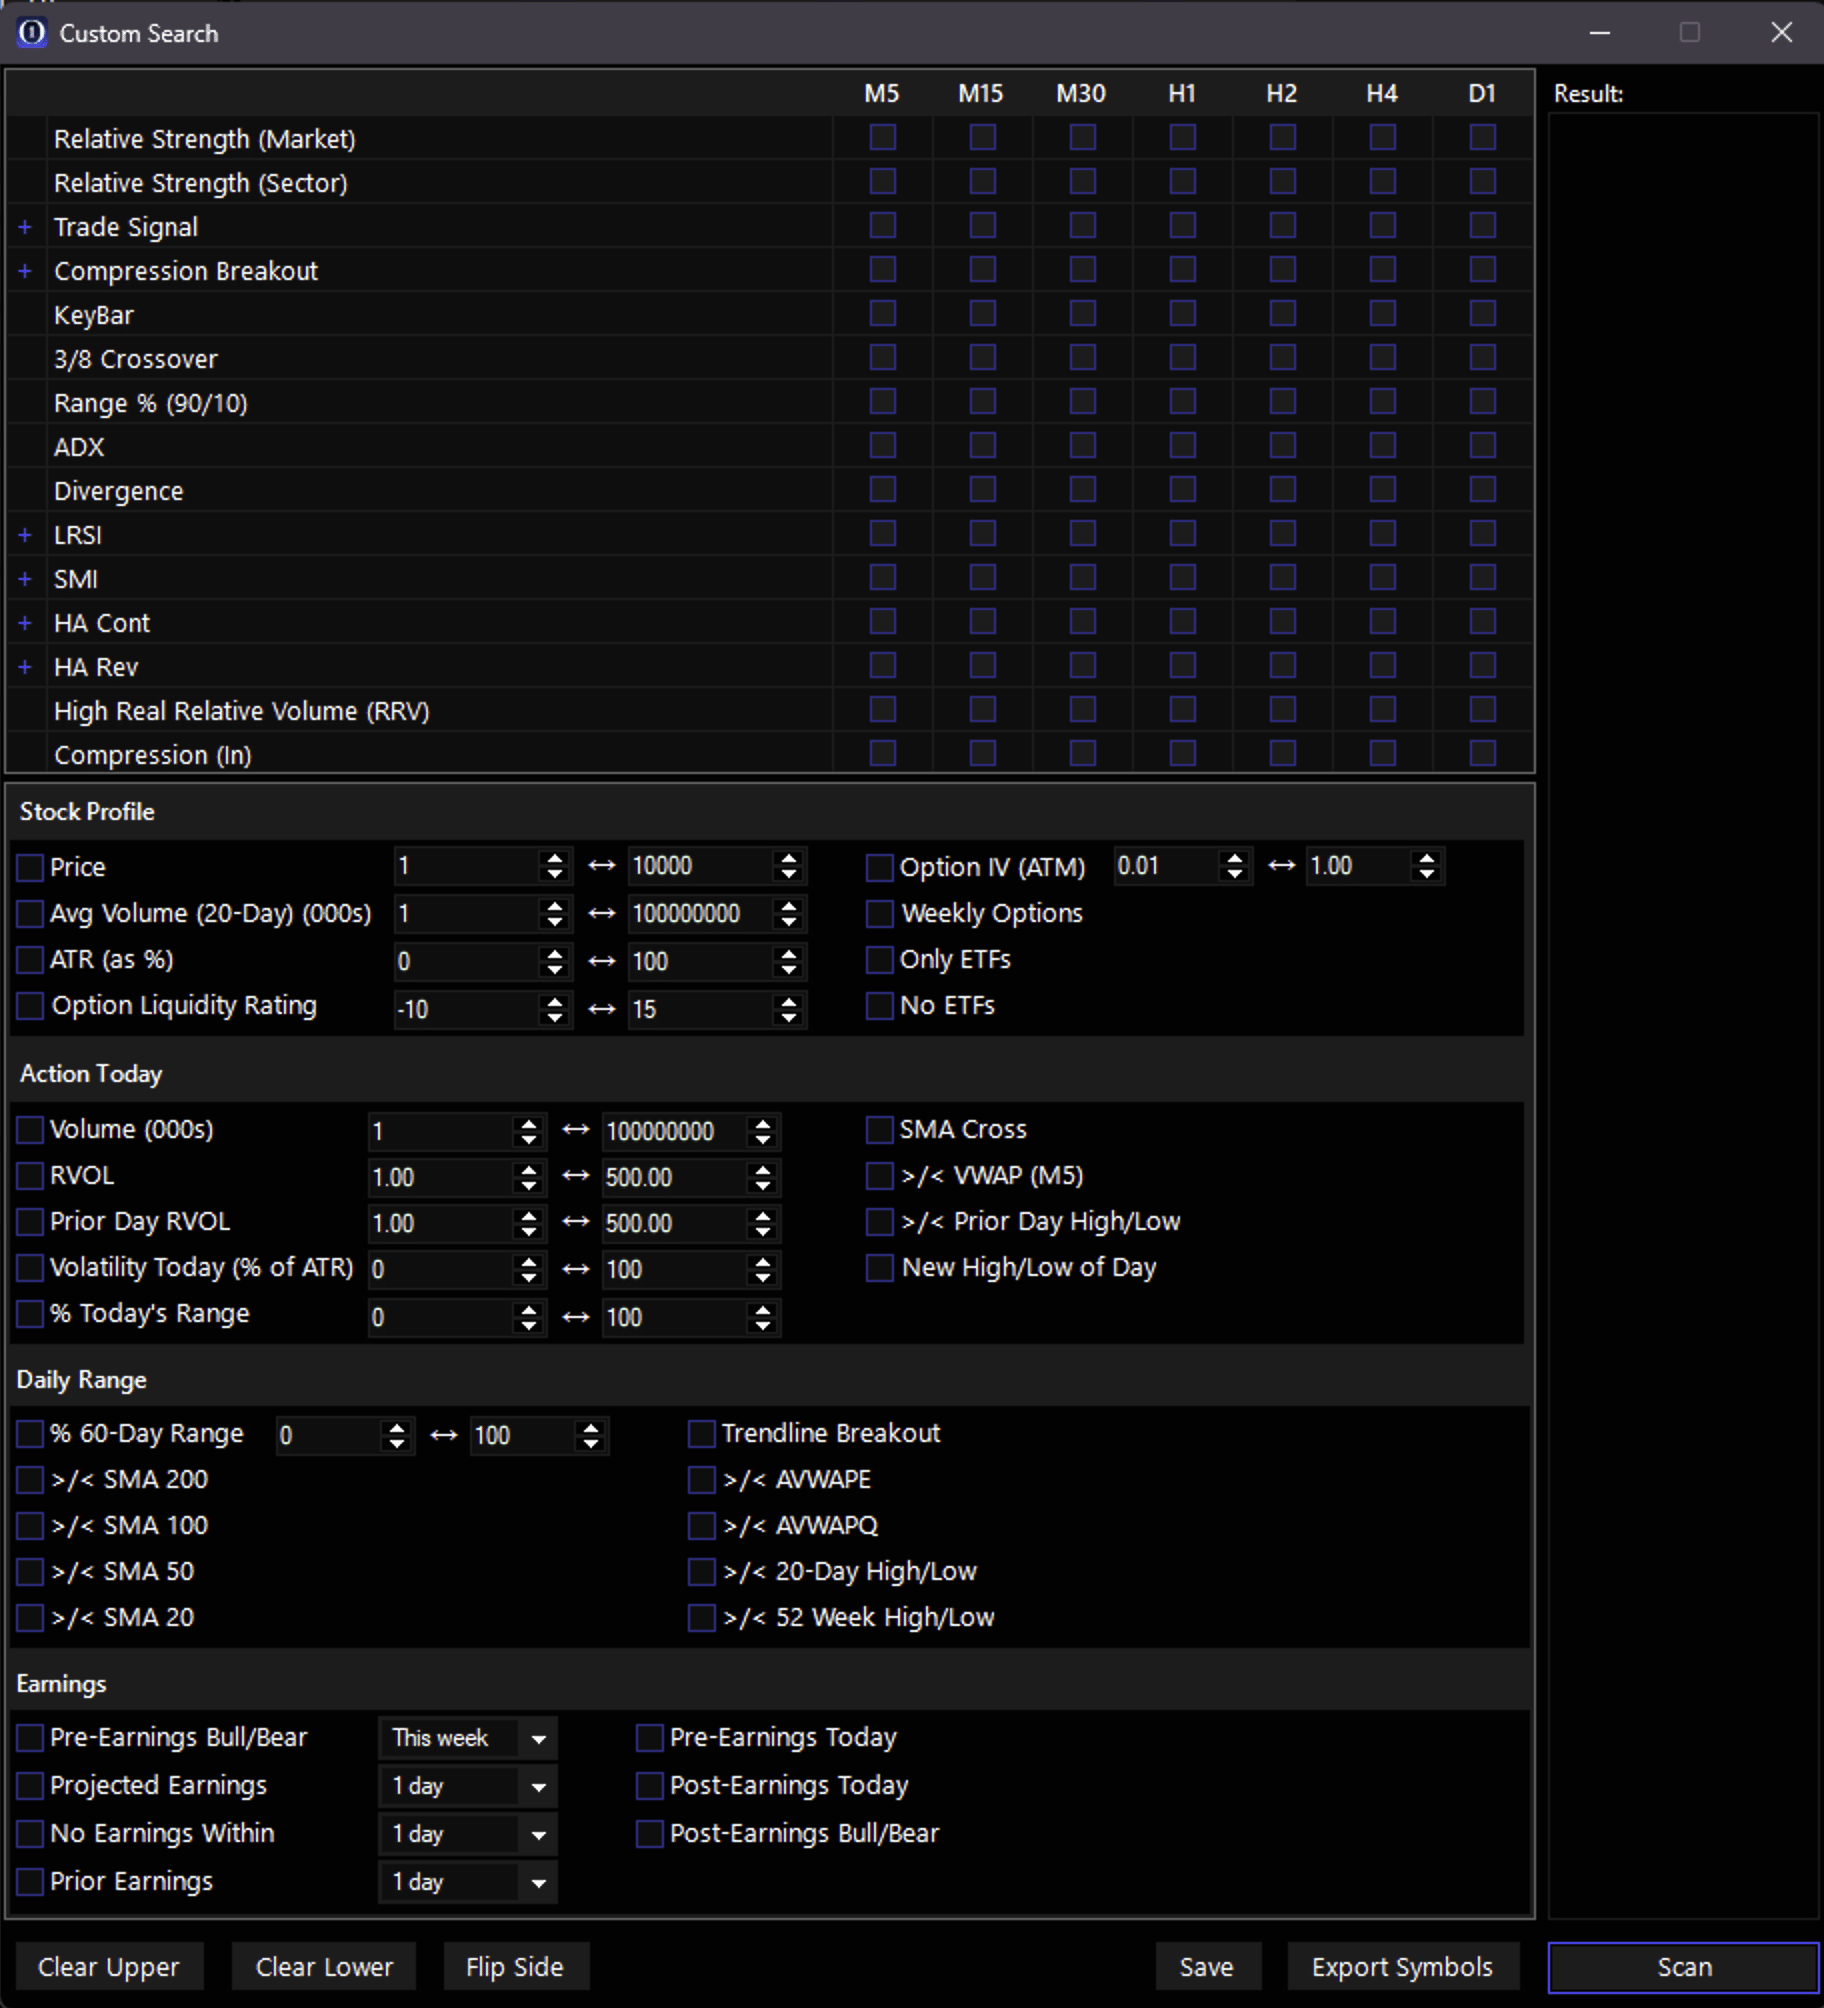
- D1 Indicator Calculation – Daily-timeframe indicators in Custom Search are now updated throughout the day for improved accuracy.
Fixed
- Workspace Loading Issues – Existing workspaces will work seamlessly with this and future updates! 🥳
- HA Candle Volume Price Bars & Key Bars – Key Bars and Volume Price Bars display has been improved for Heikin Ashi candle compatilibilty.
- Assorted Stability Enhancements
Visit www.oneoption.com/release-notes for a complete list of updates.
Automated Trendlines: Bal 1OTL
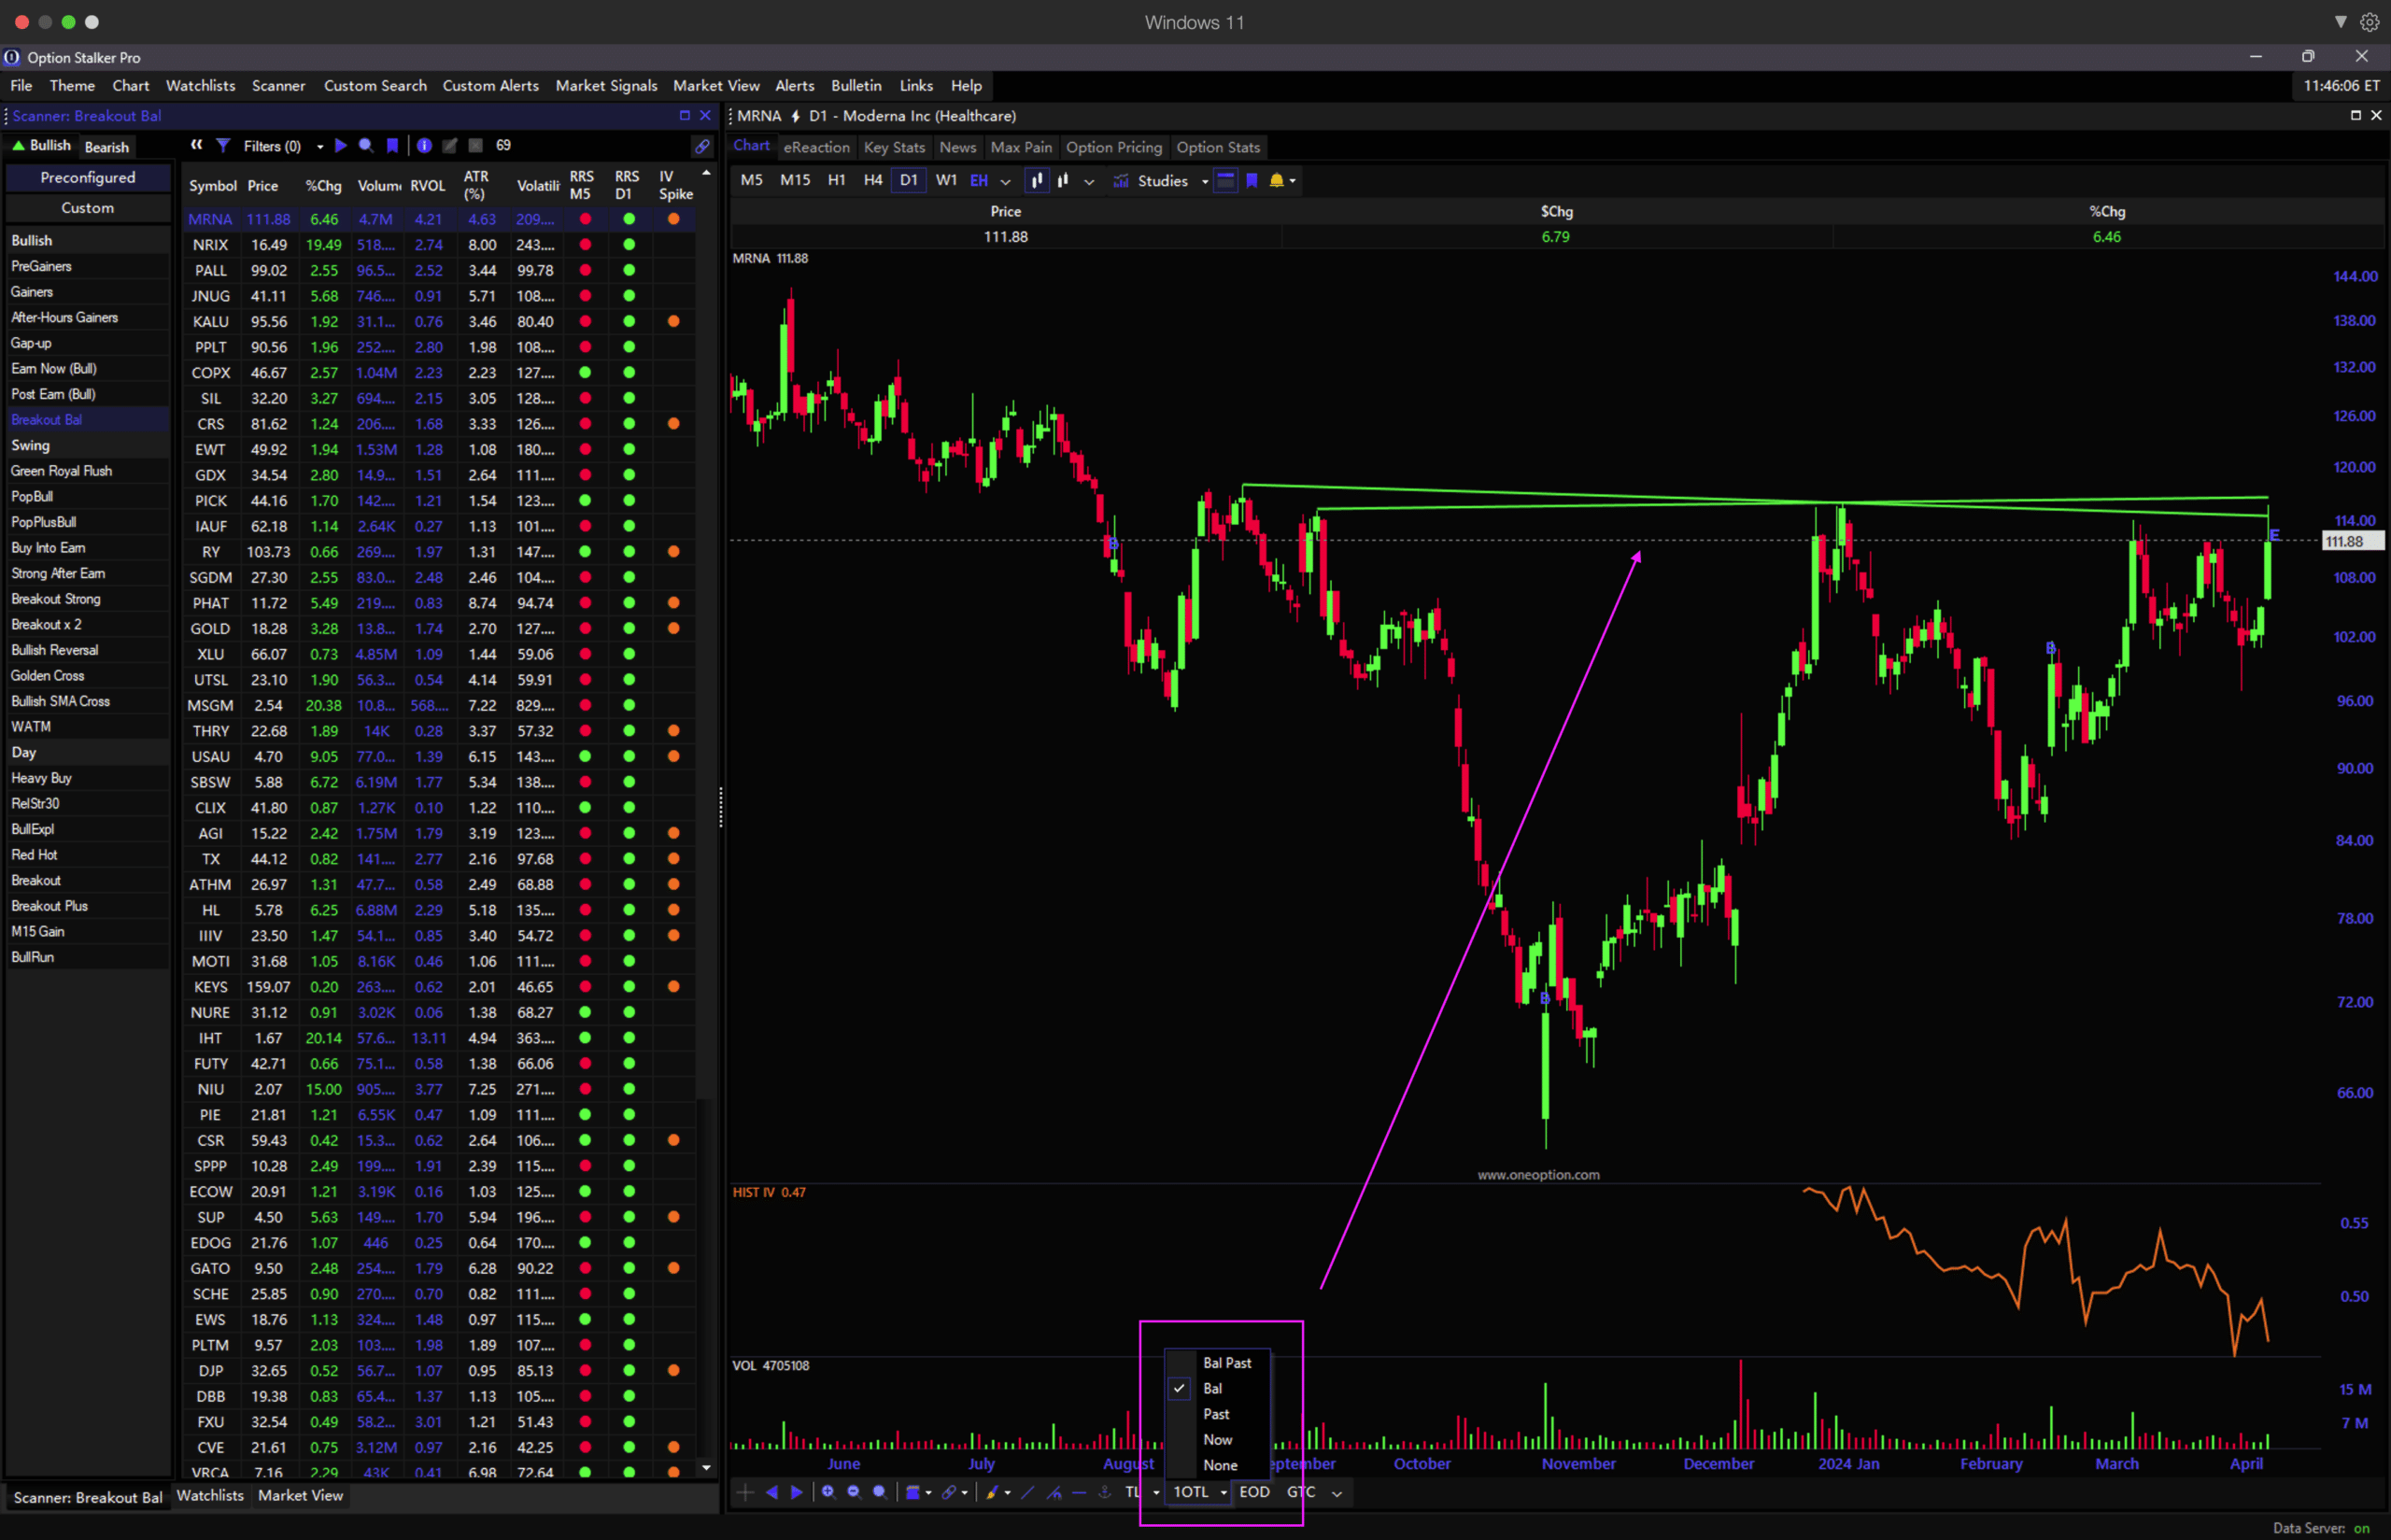
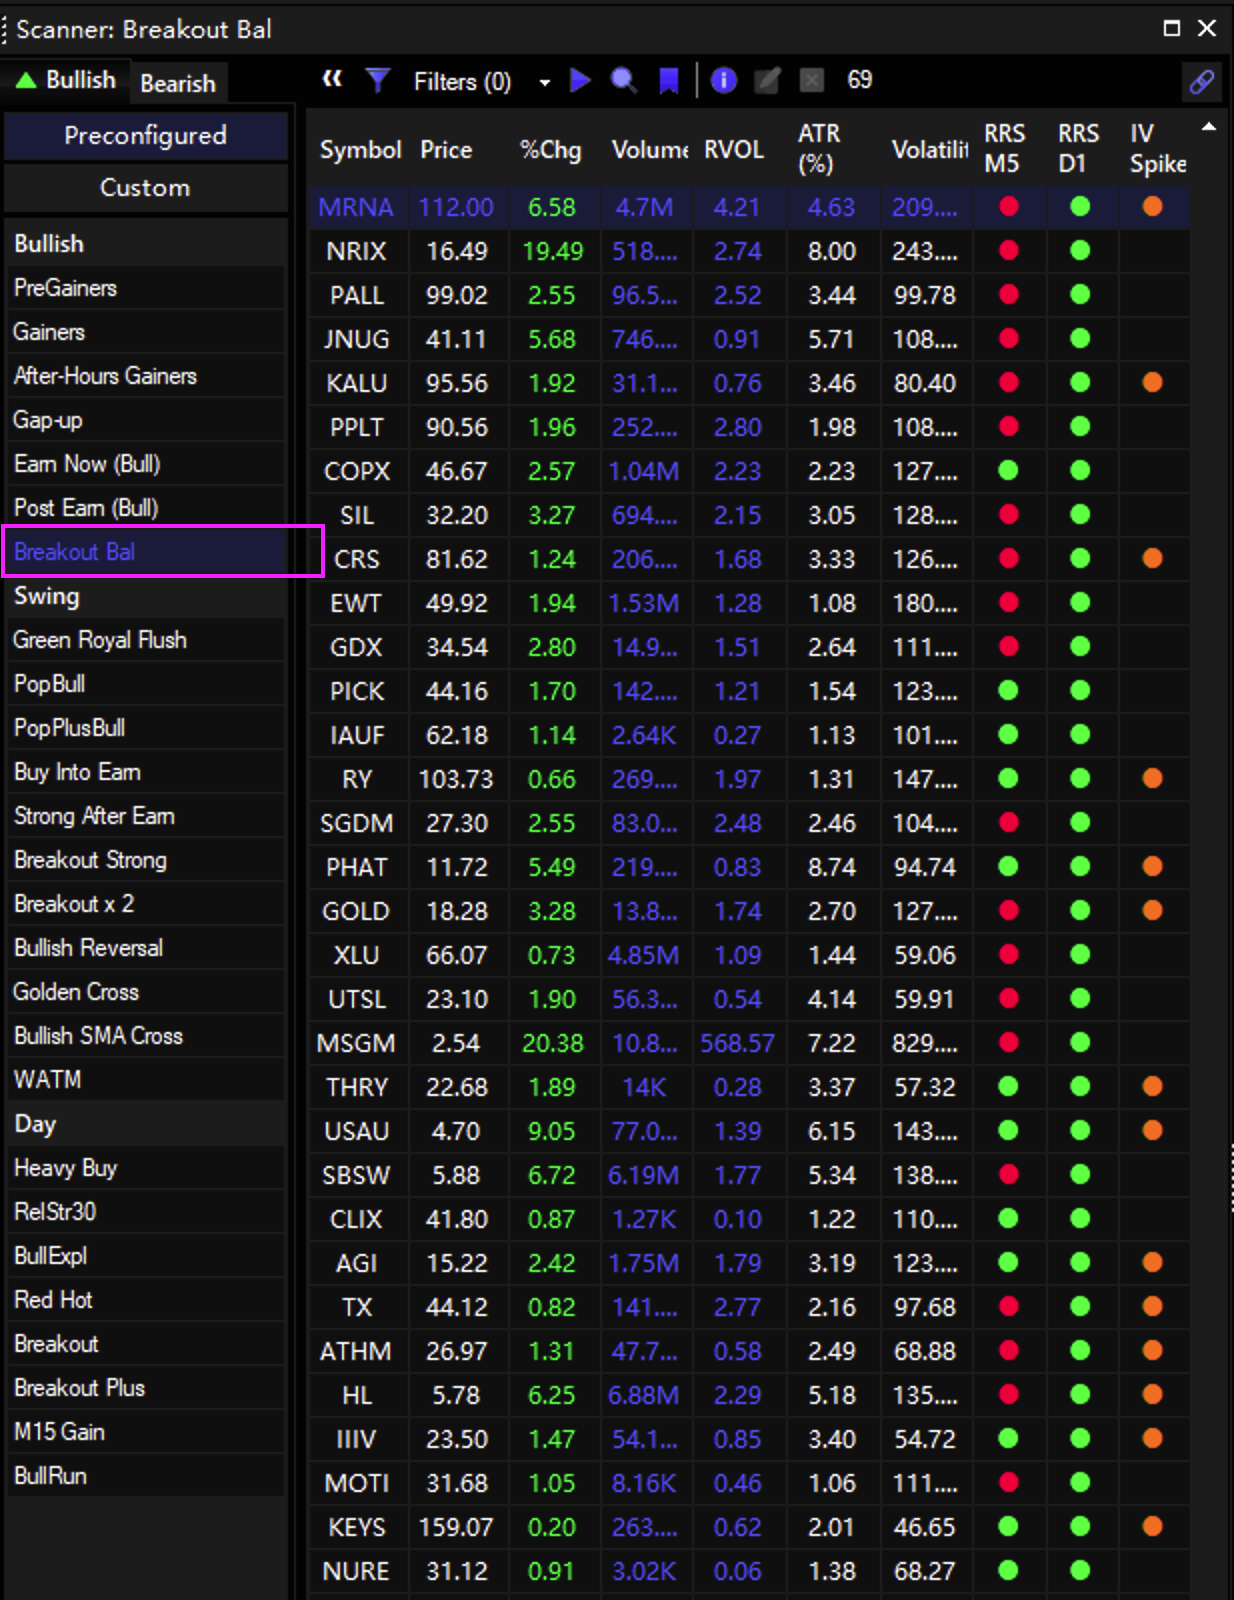
Breakout Bal Scanners
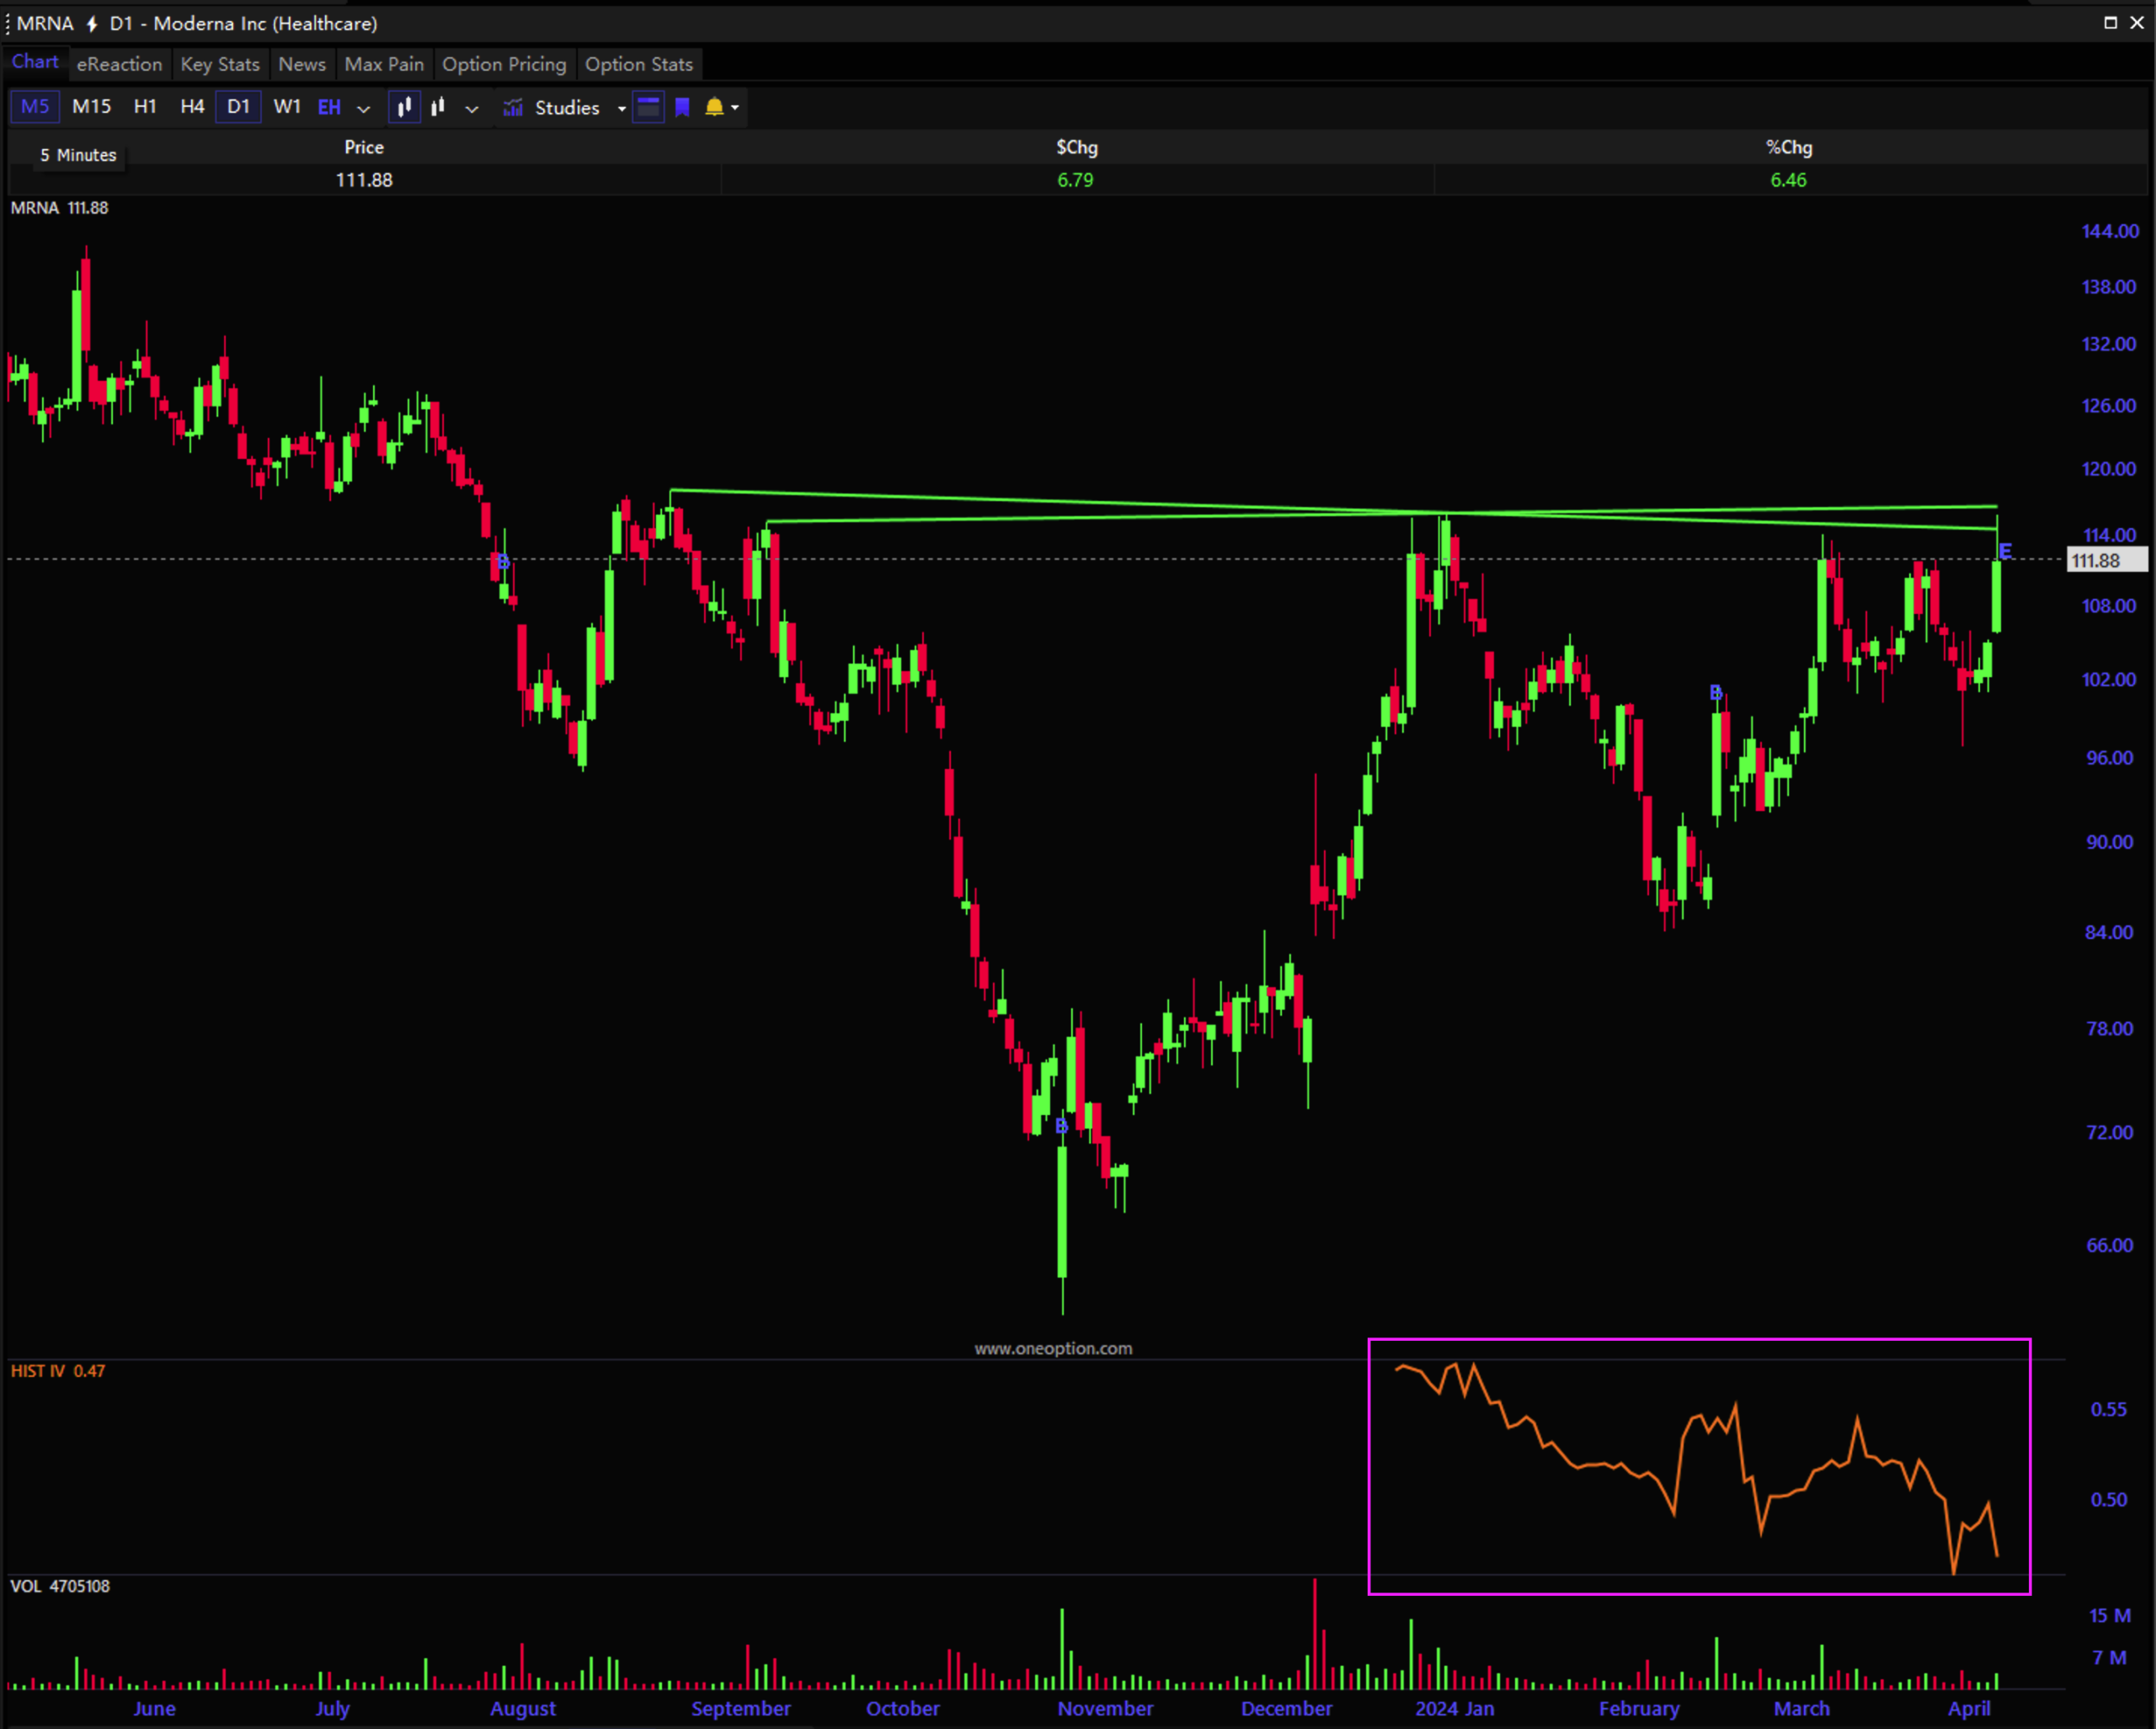
Hist IV (Indicator/Study)
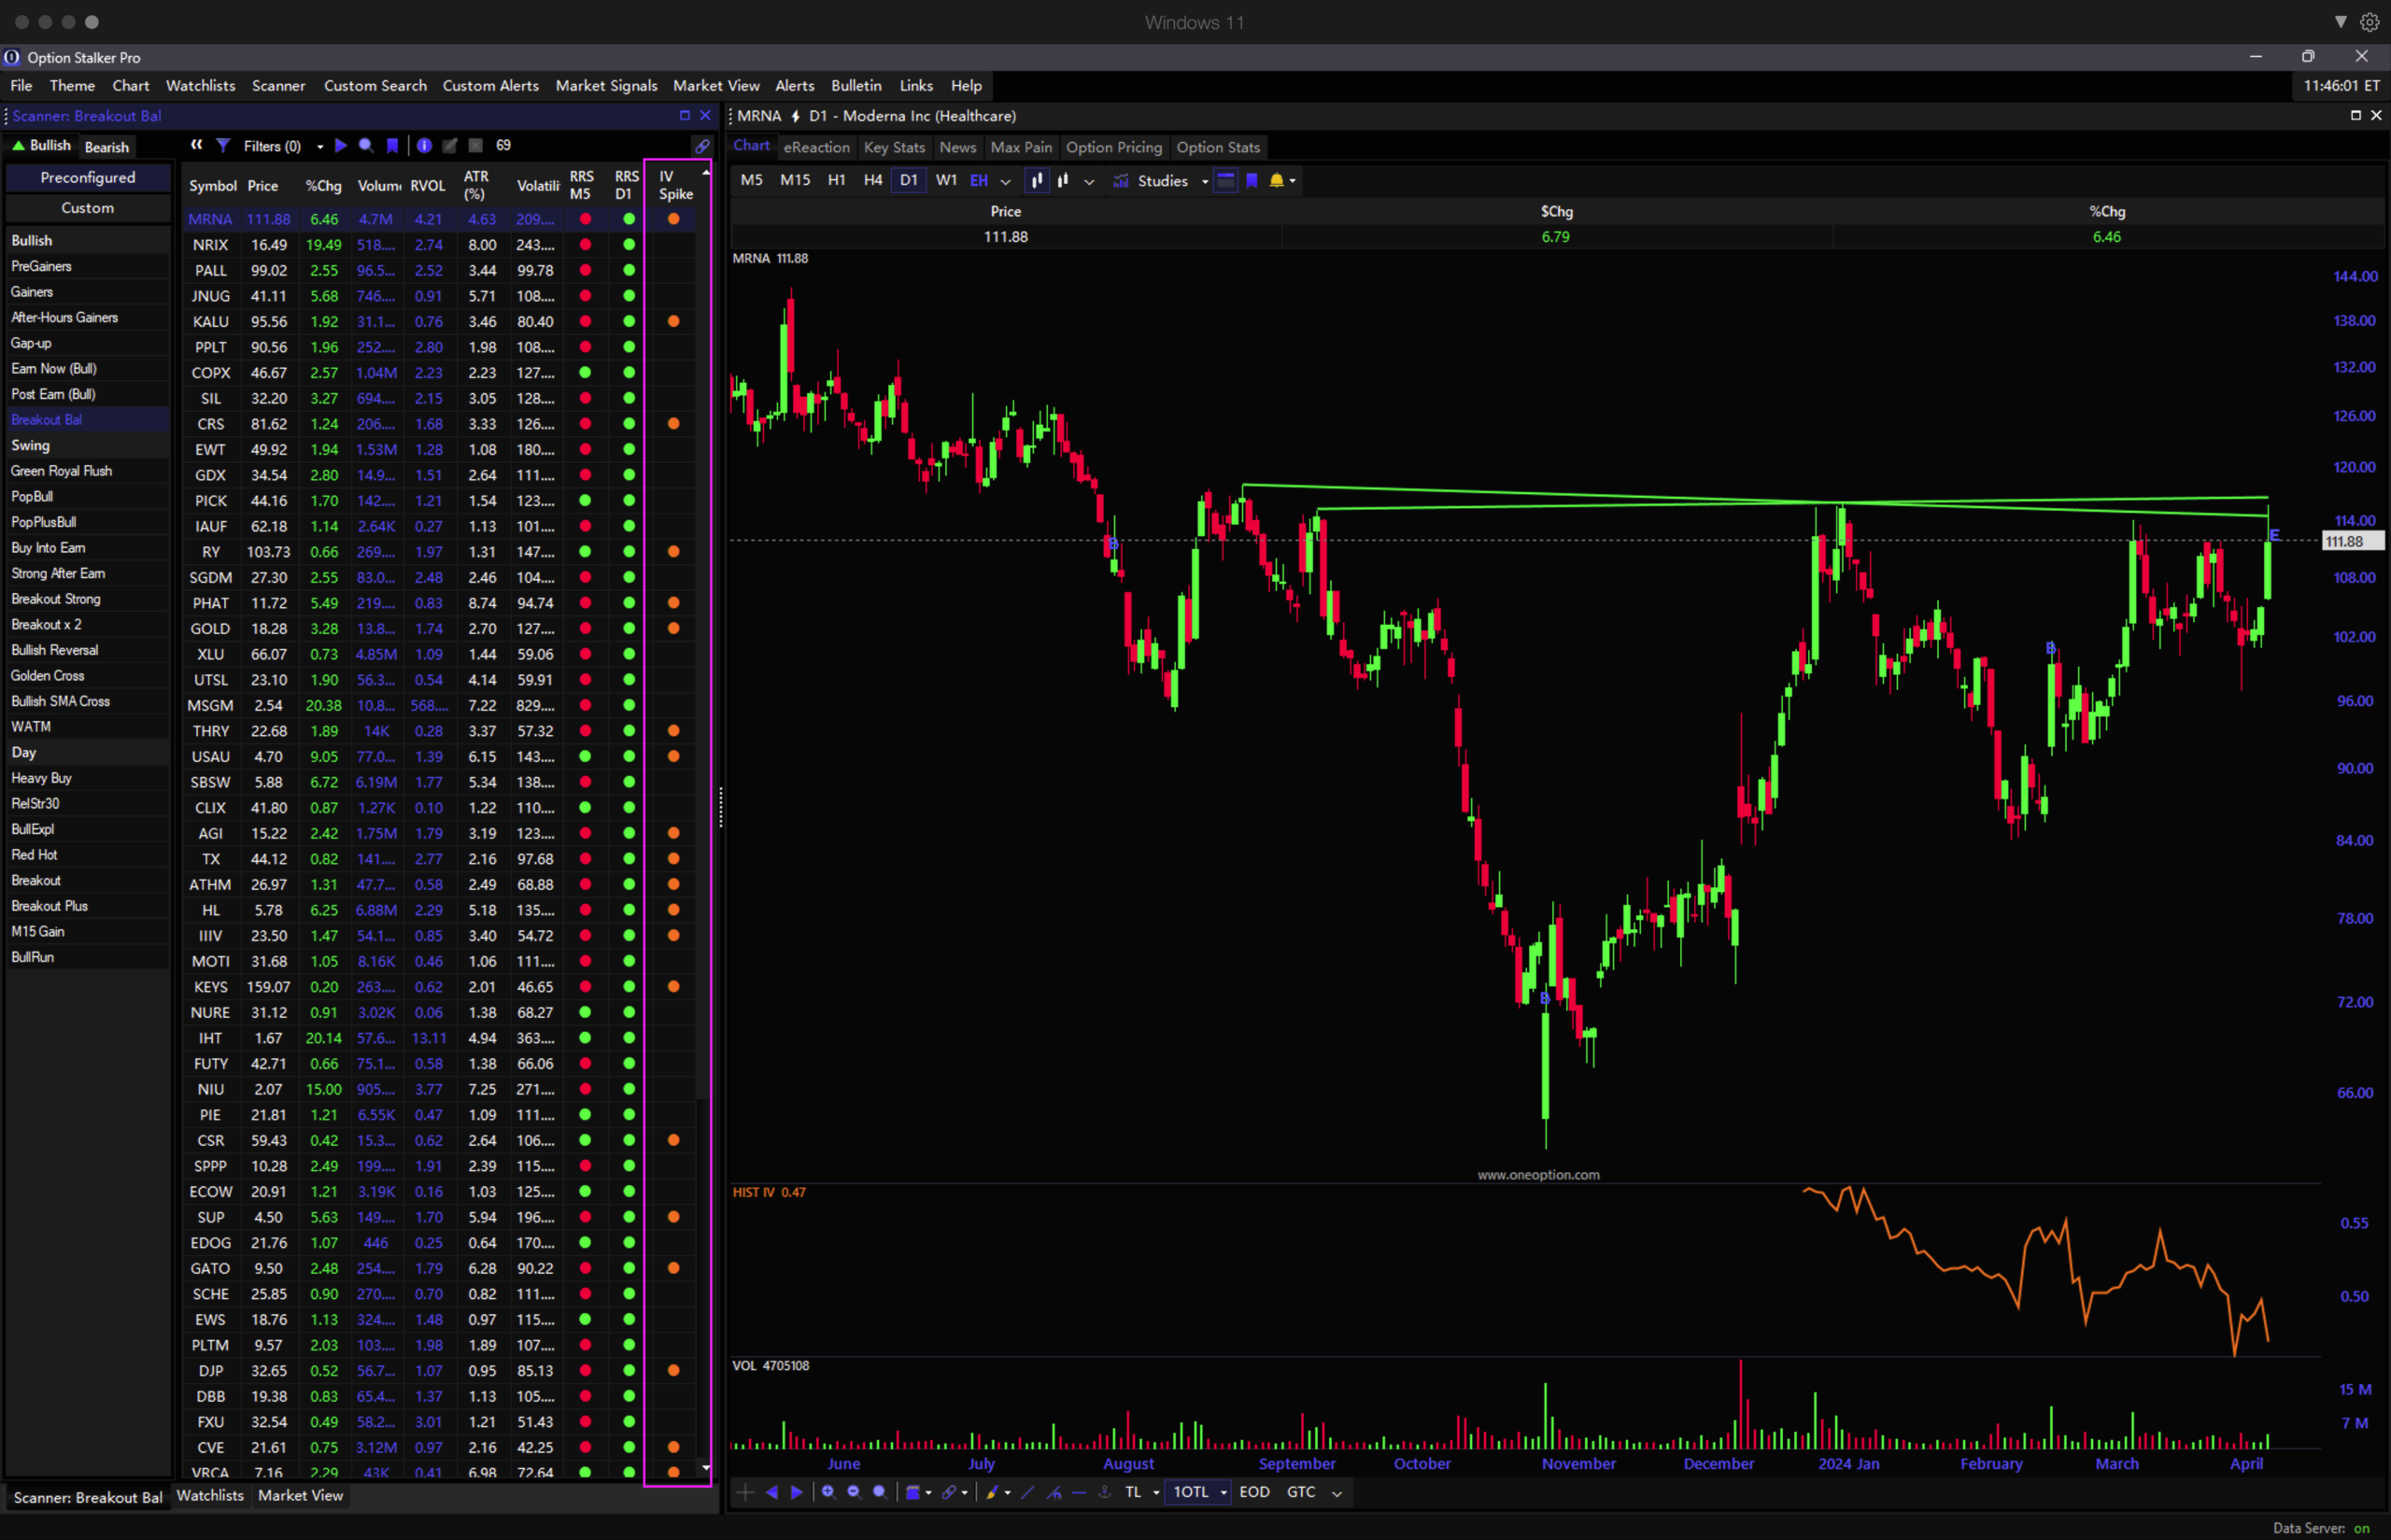
IV Spike (Column)
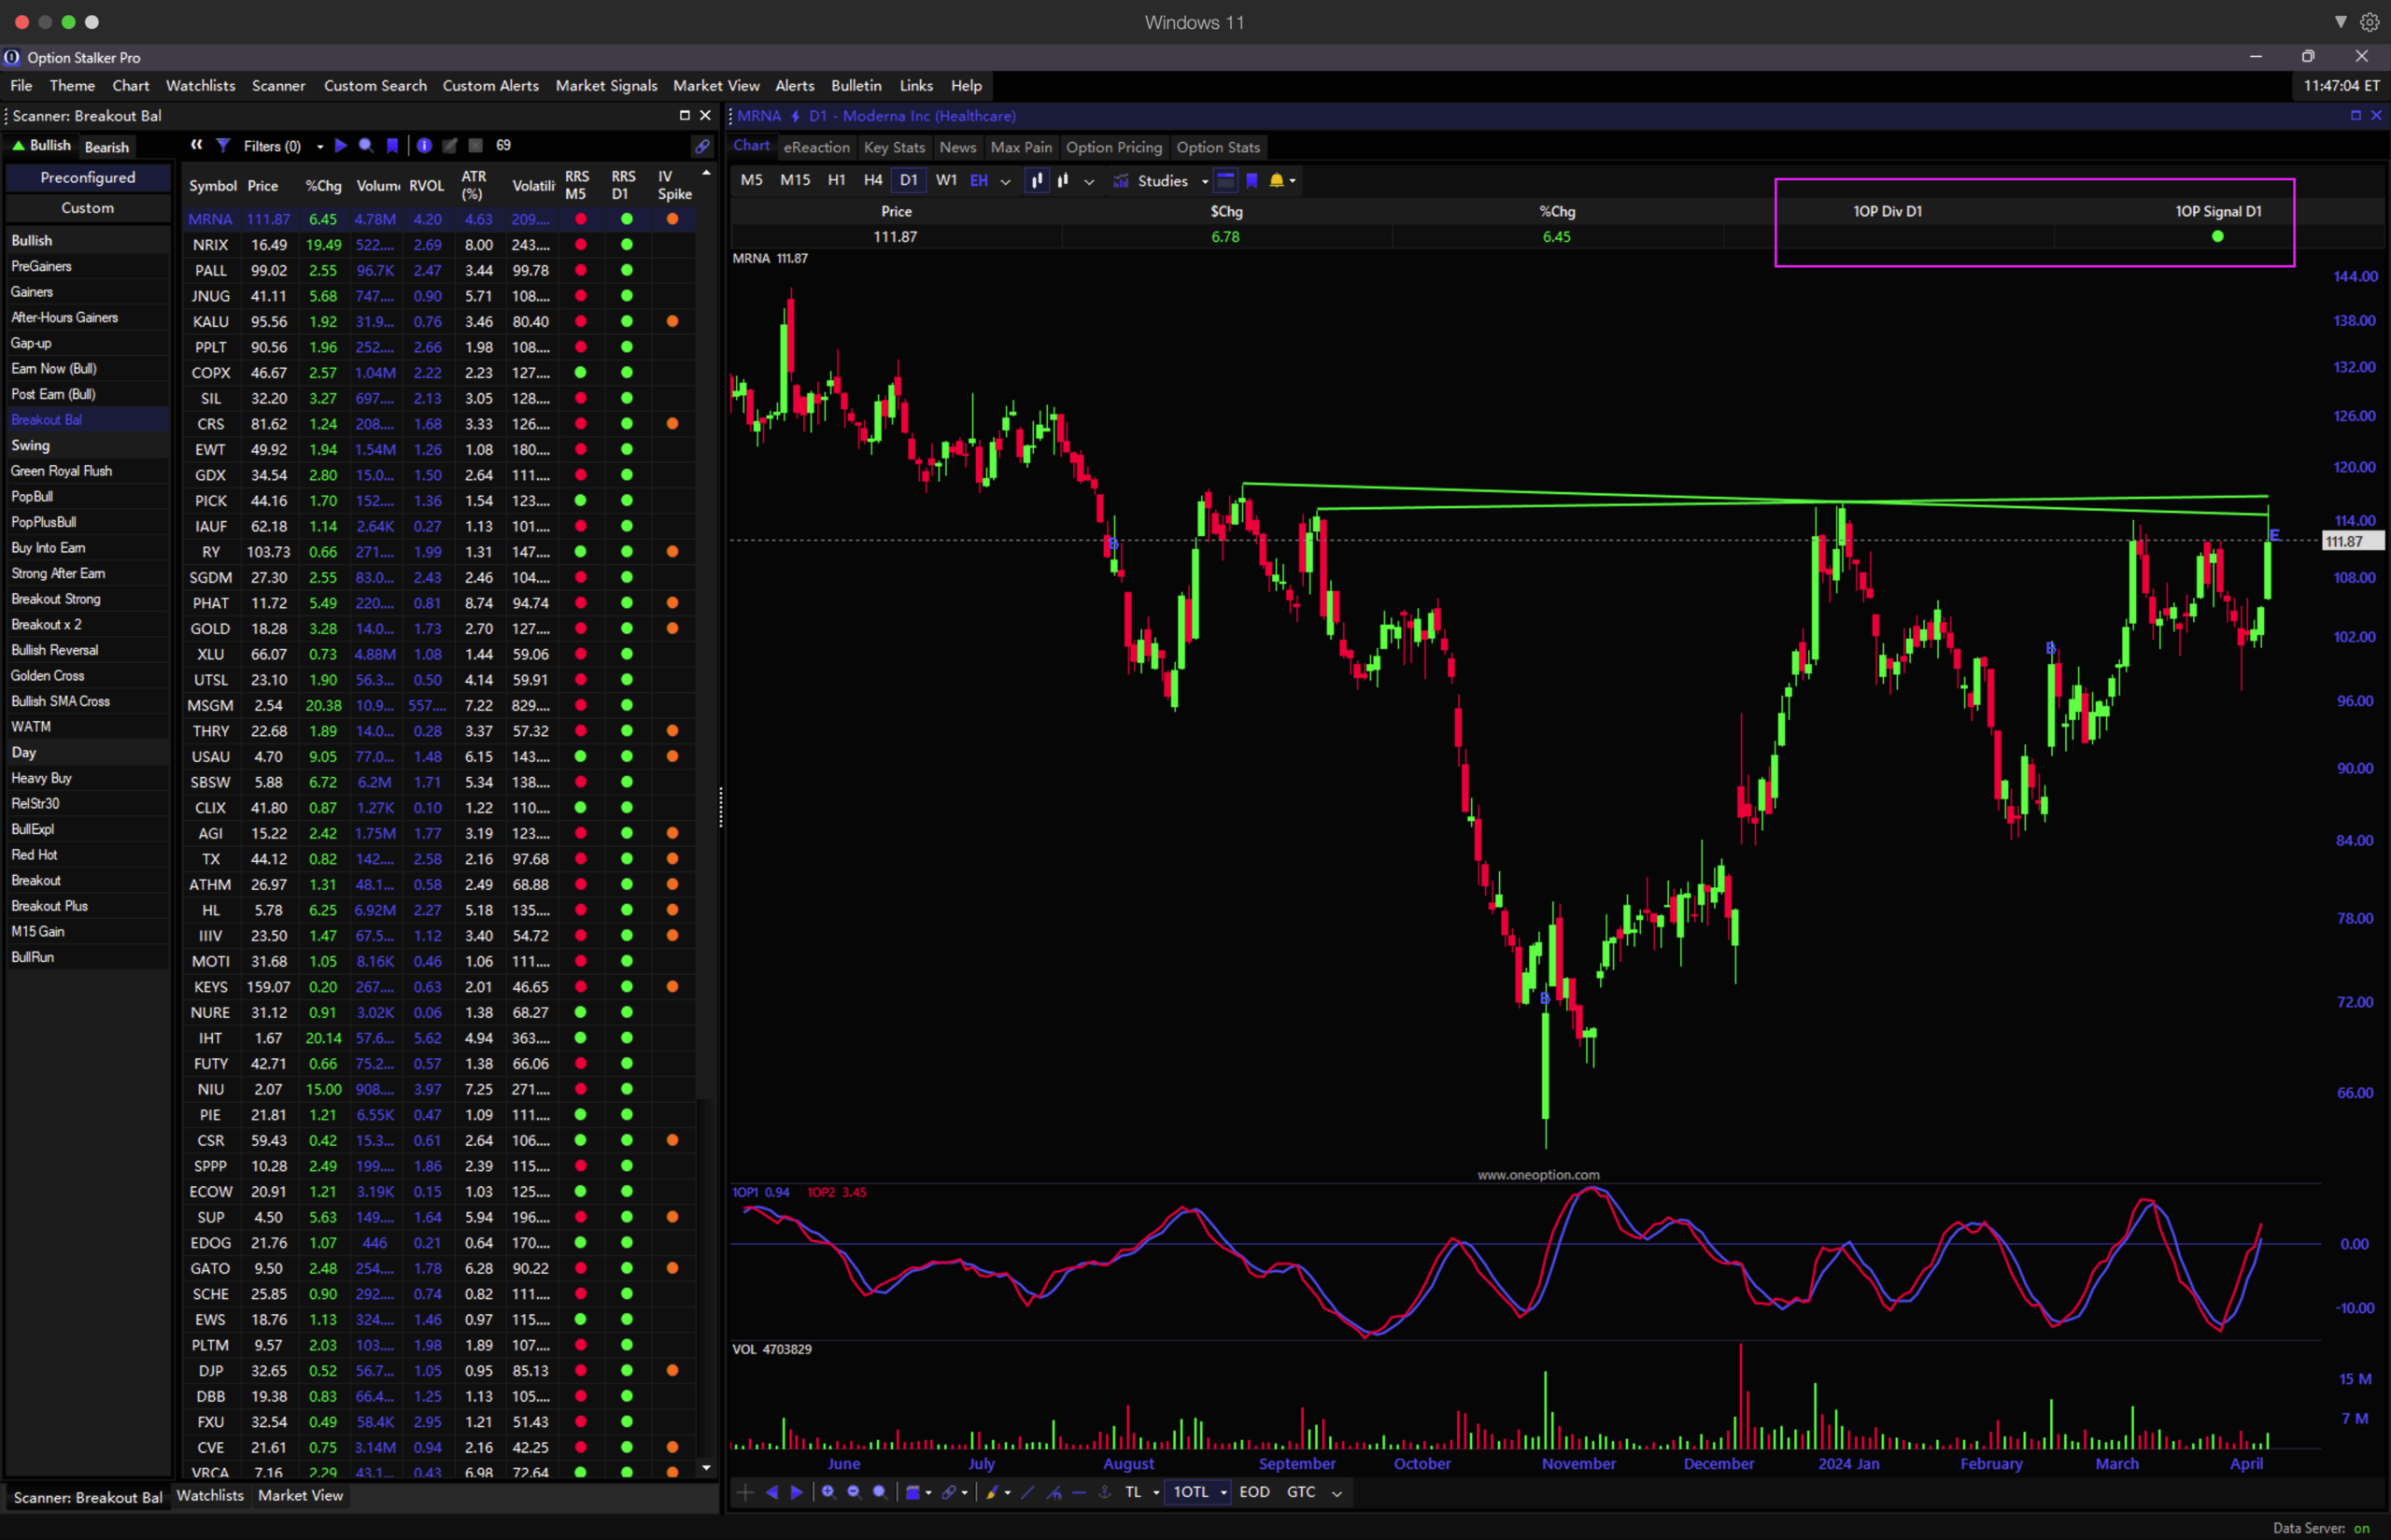
1OP Signal & Divergence (Columns & Alerts)
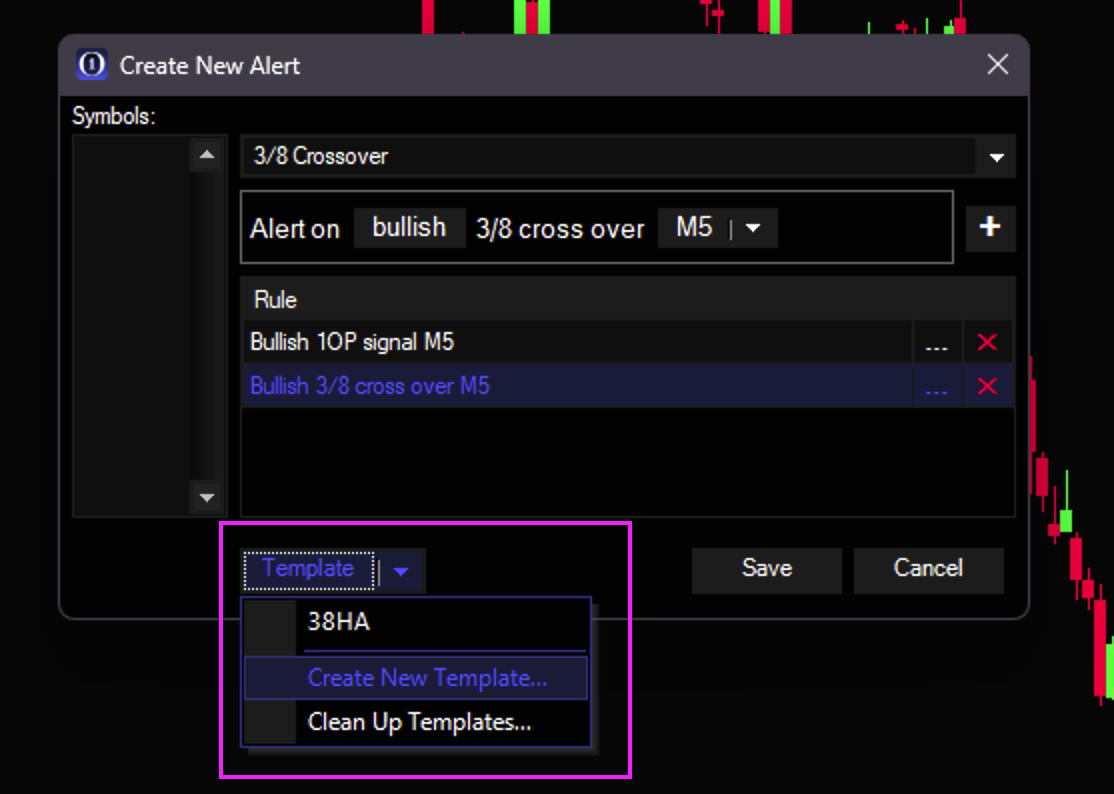
Alert Templates
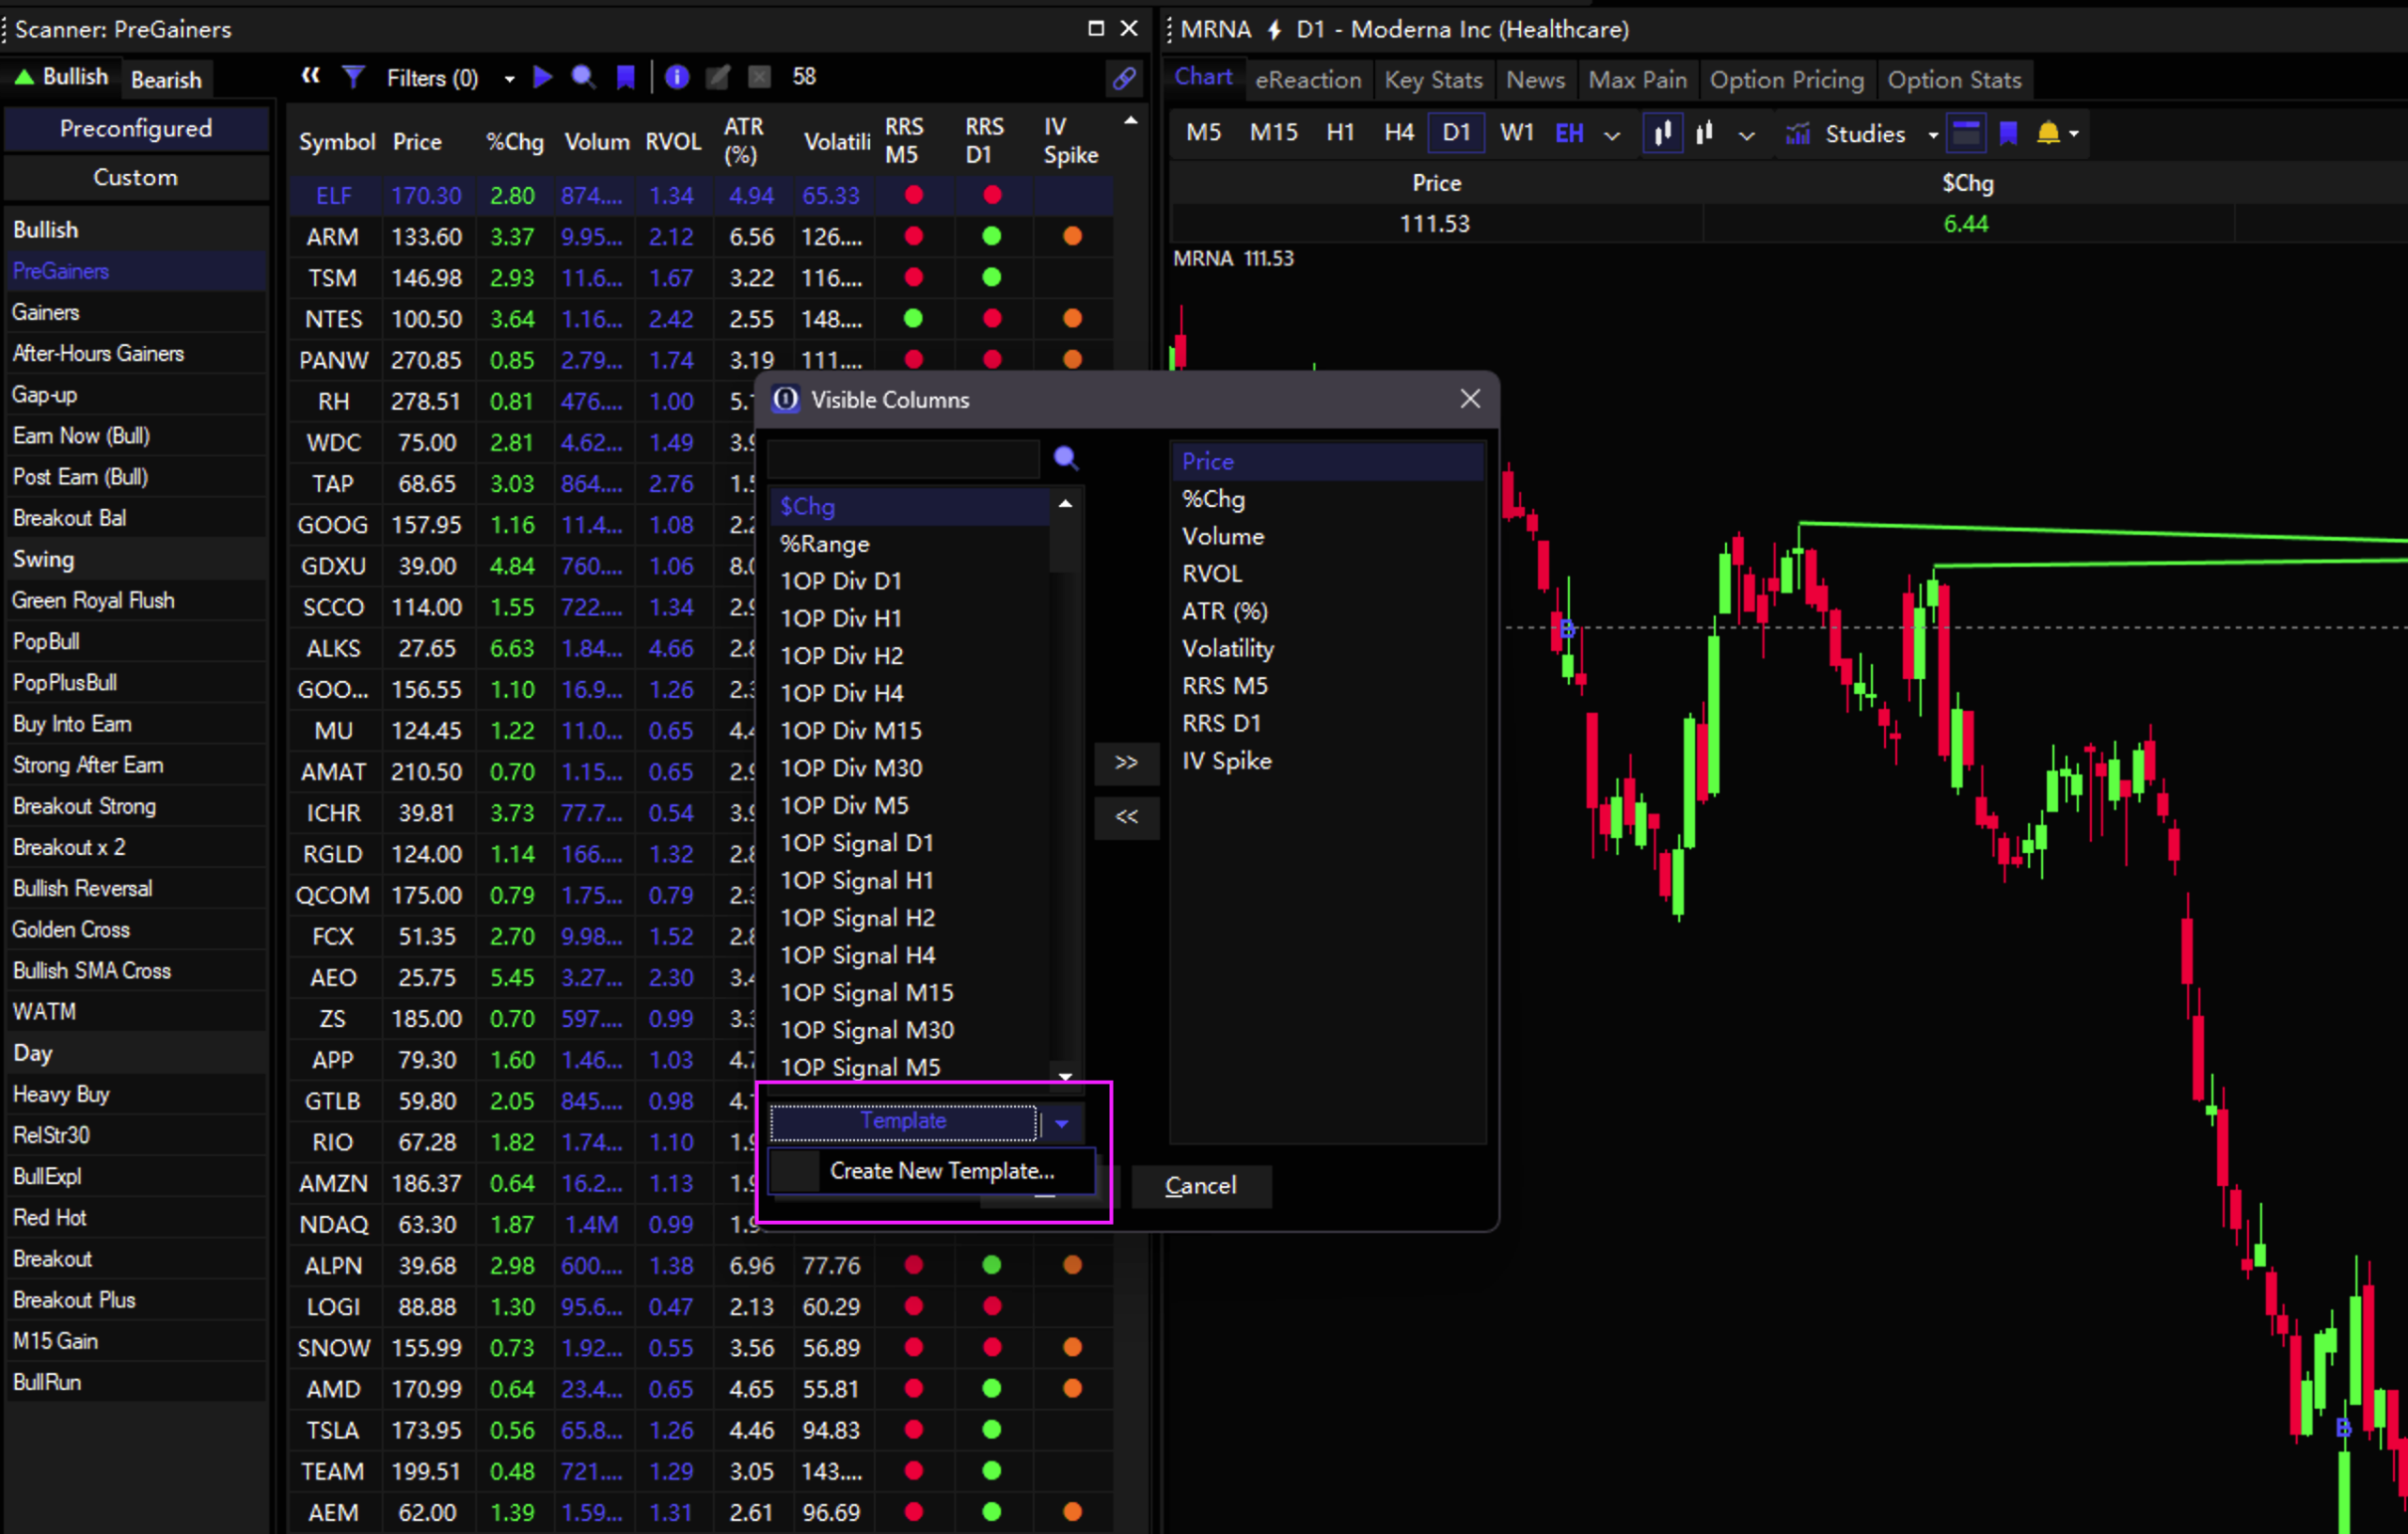
Column Templates
New Alert Popup Design
February 2024
We’re excited to announce substantial improvements to Option Stalker Pro.
⚠️ Note: This update will break some existing workspaces. If certain charts do not load, simply remove those charts, re-add them, and re-save your workspace.
Video Tour
Main Updates
Other Updates
- 1OSI is back!
- New trendline drawing tool: Snap Line (Magnetic line tool in the bottom chart toolbar)
- New VWAP, AVWAP(E,Q) Standard Deviation (SD) Line configuration dialogues
- Customizable Auto Play/Flip speed (via File > Settings)
- AVWAP (user-defined) button now in lower toolbar (Anchor icon)
- New Scanner Keybindings:
Spacebarselects the next row and loads linked charts.Returnkey will start/stop the auto-flip - Set whether Tags (in Watchlists) are reset each day (via File > Settings)
- Hide unwanted buttons in the bottom chart toolbar
Visit www.oneoption.com/release-notes for a complete list of updates.
Default Colors and Workspaces
Custom Search UI & Variables
Flip Side Button
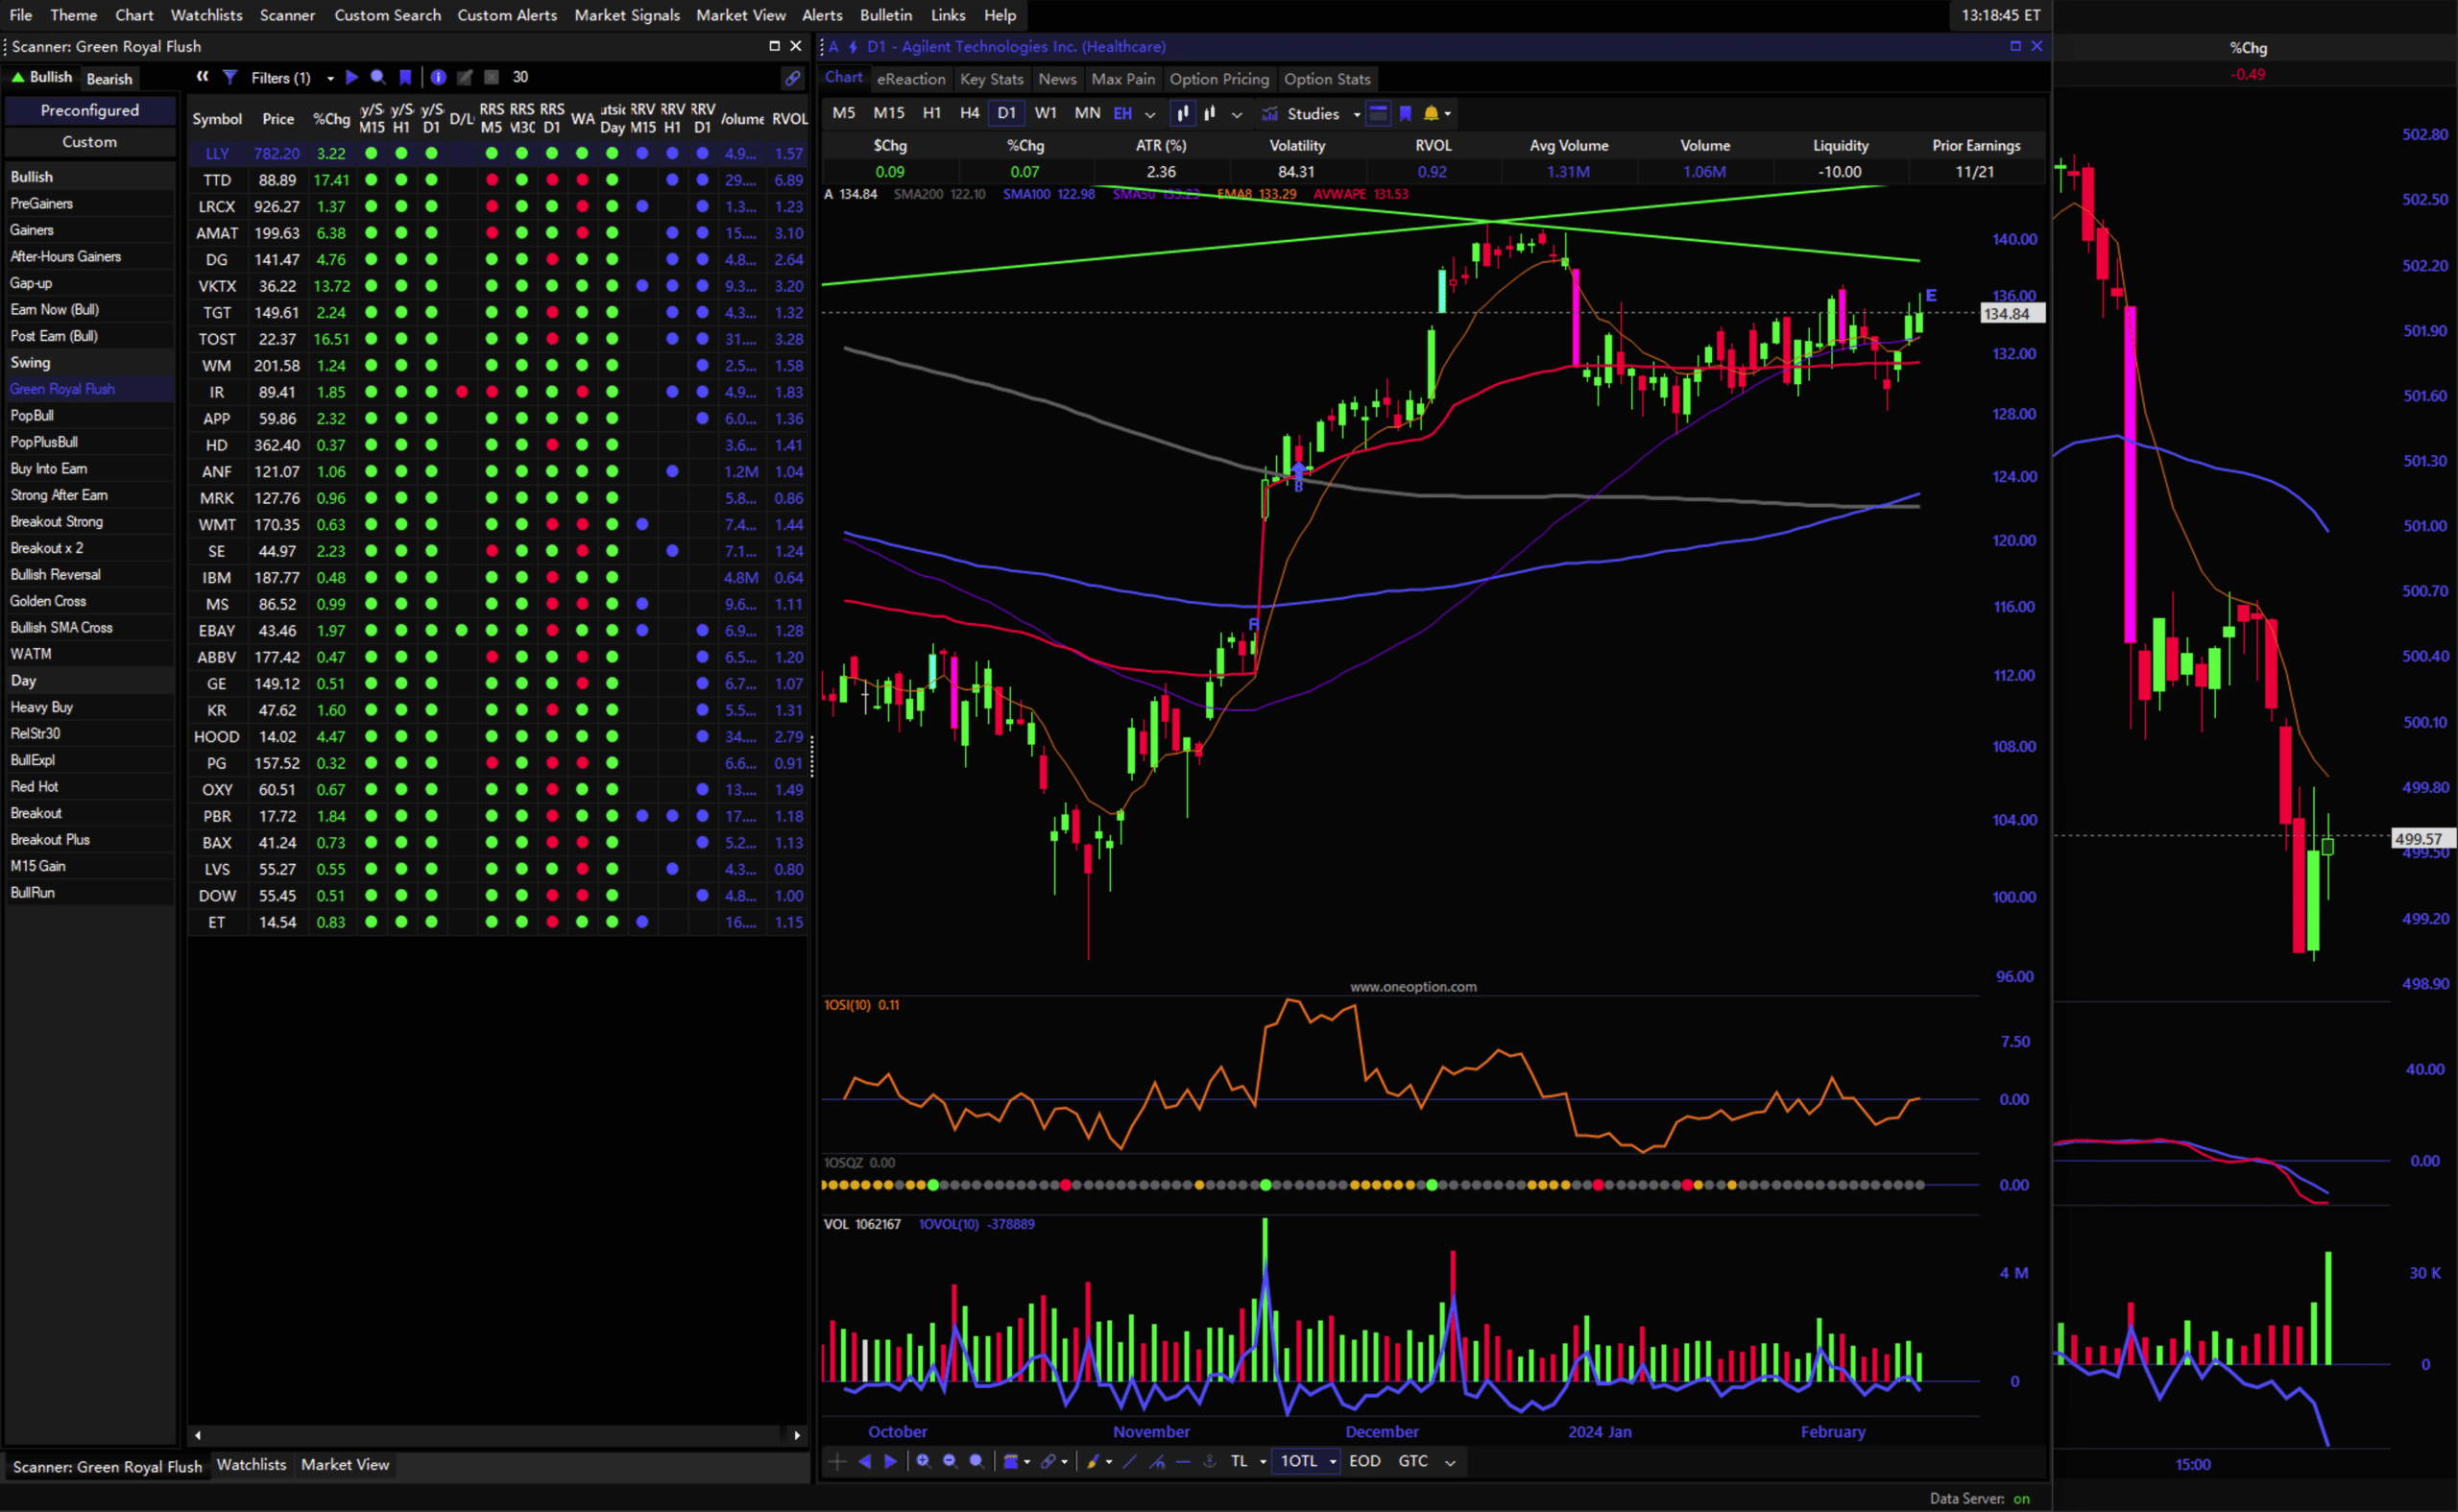
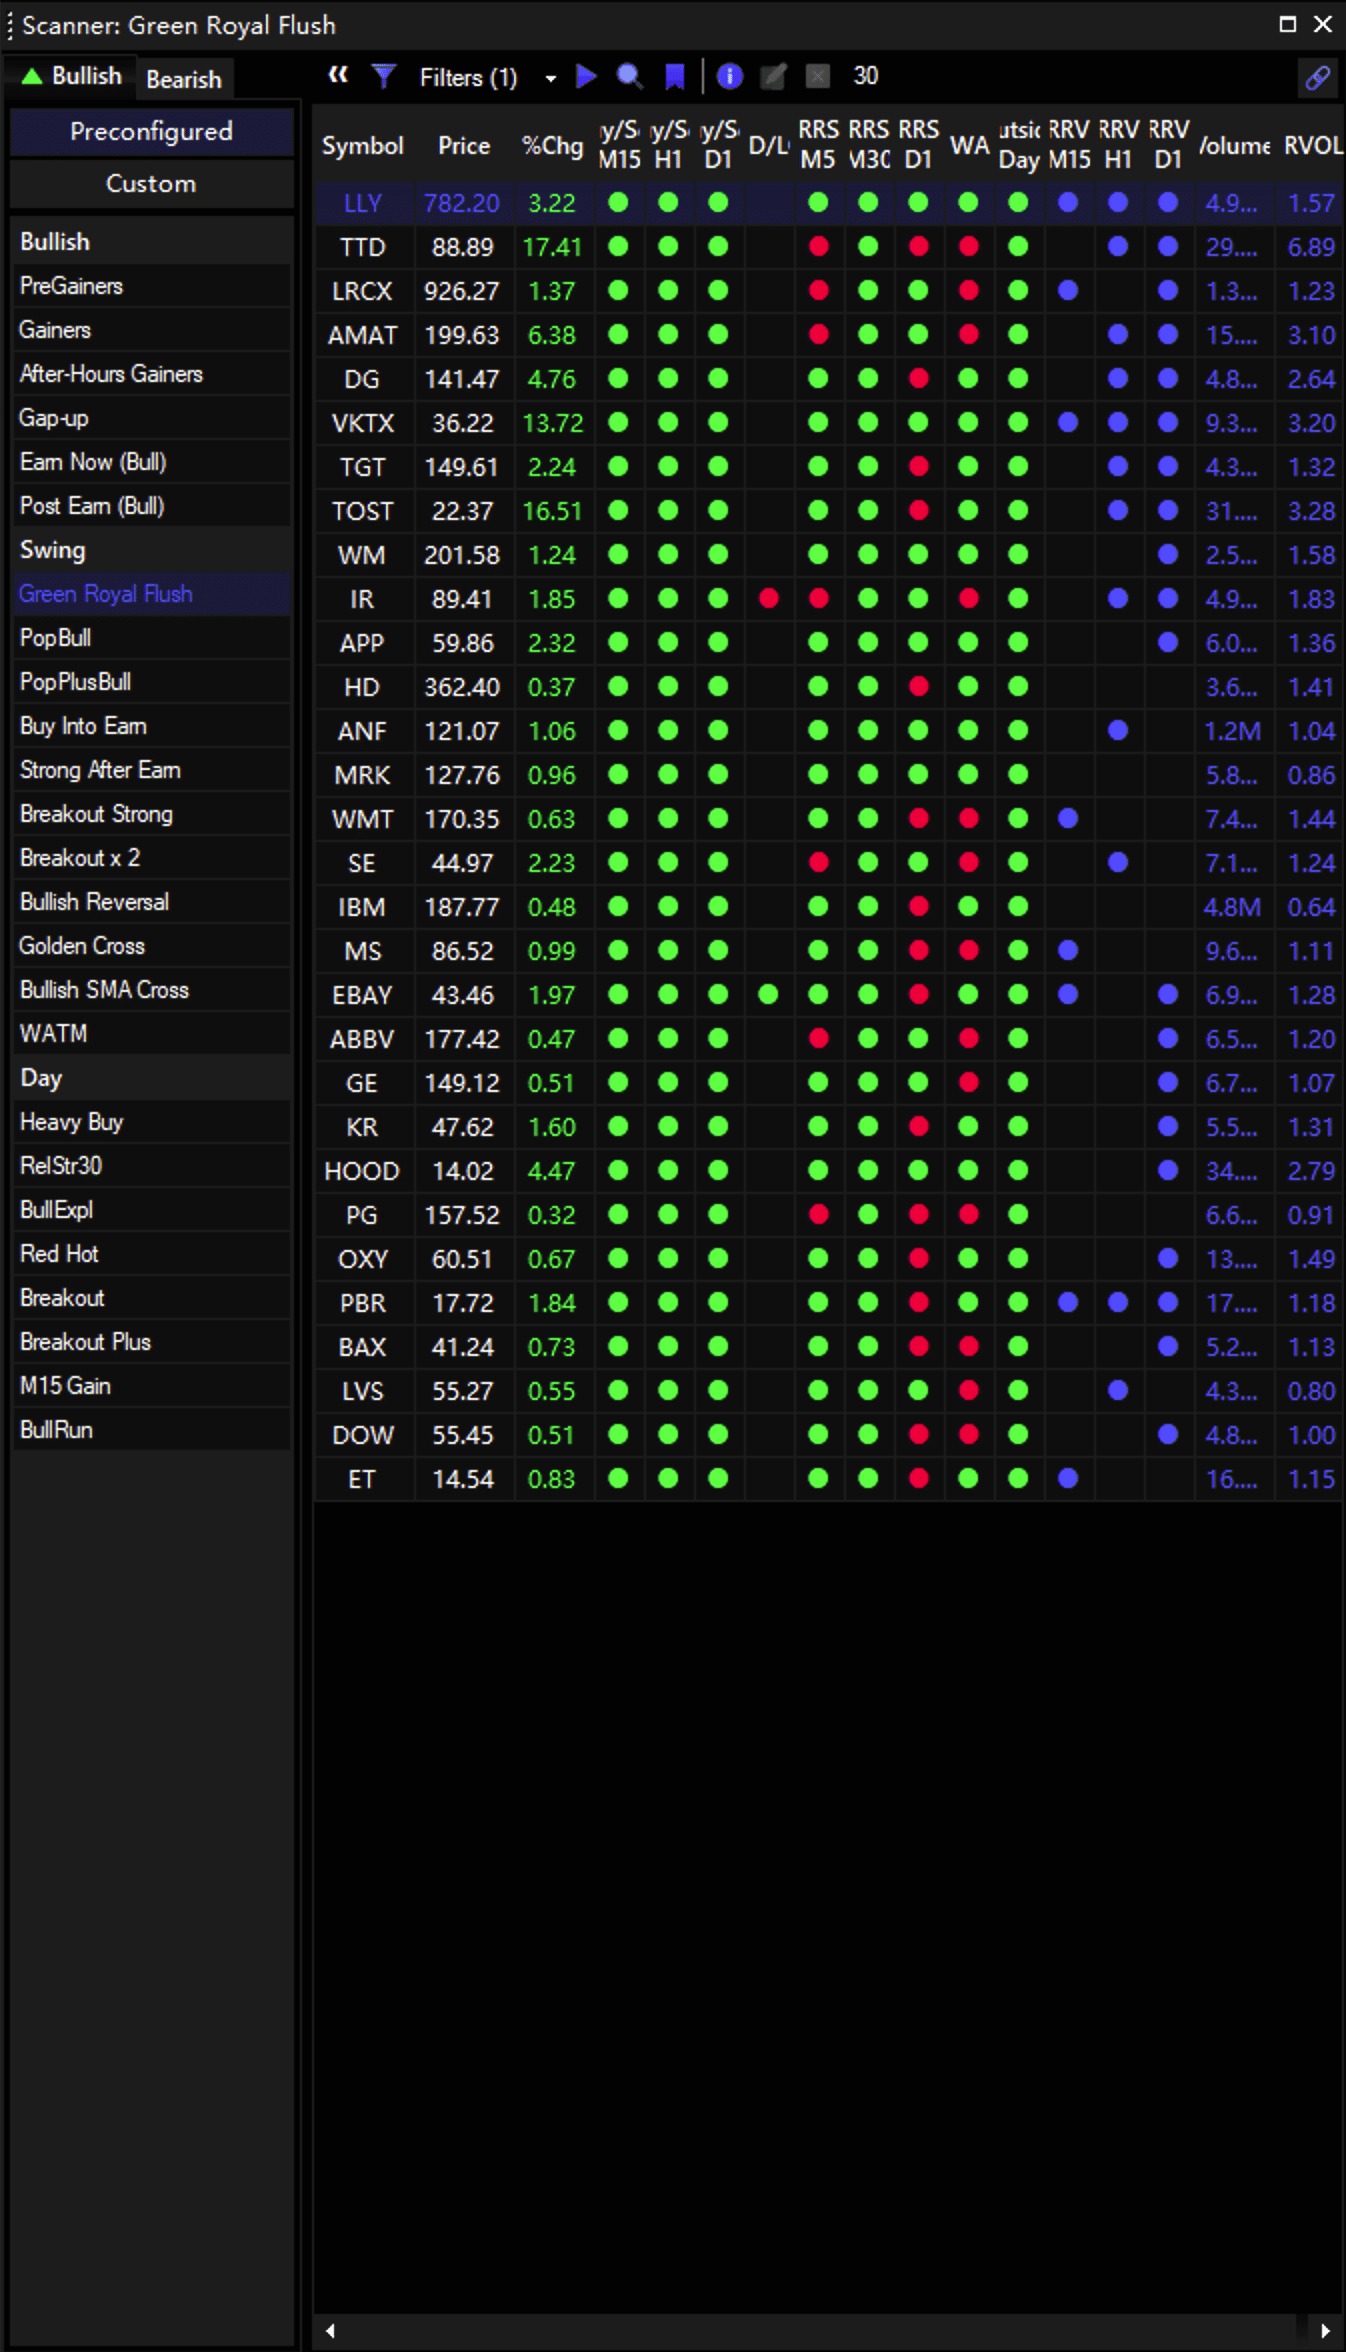
Updated Scanner
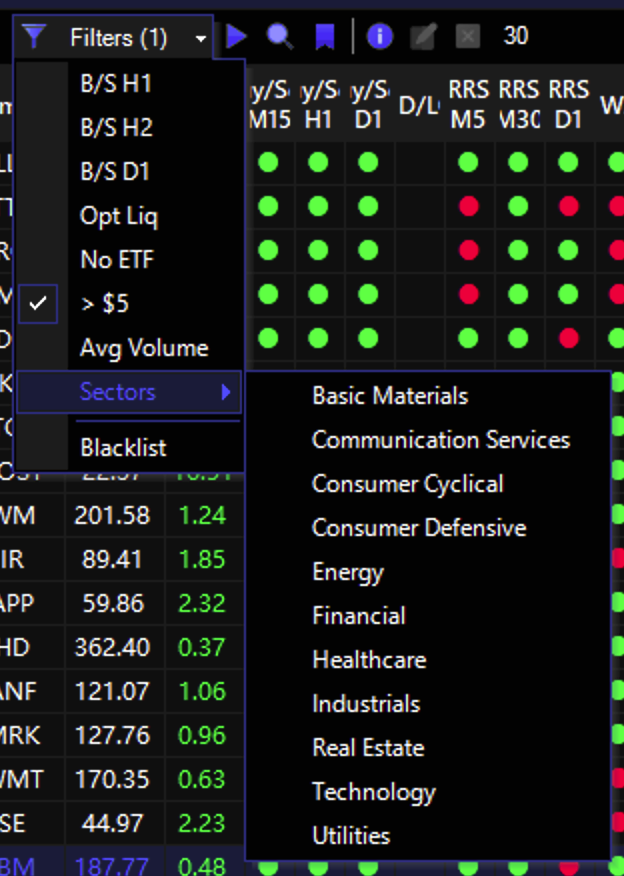
Scanner Filters
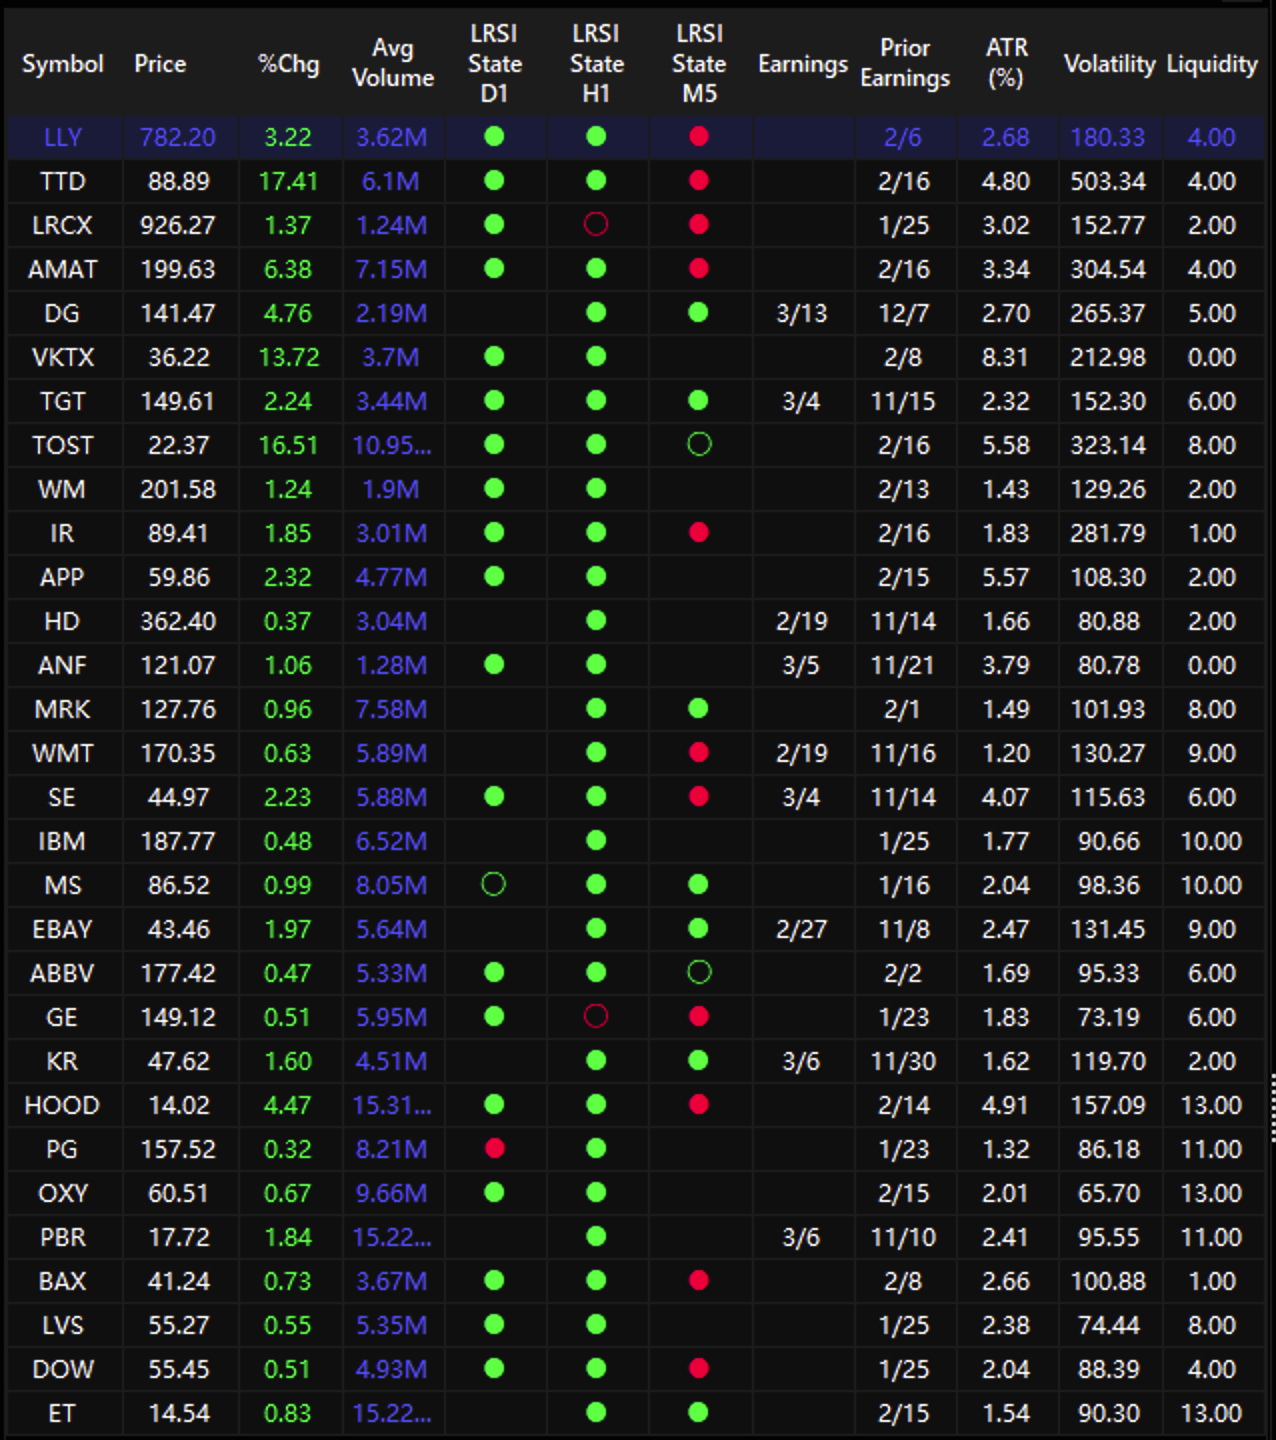
List Columns
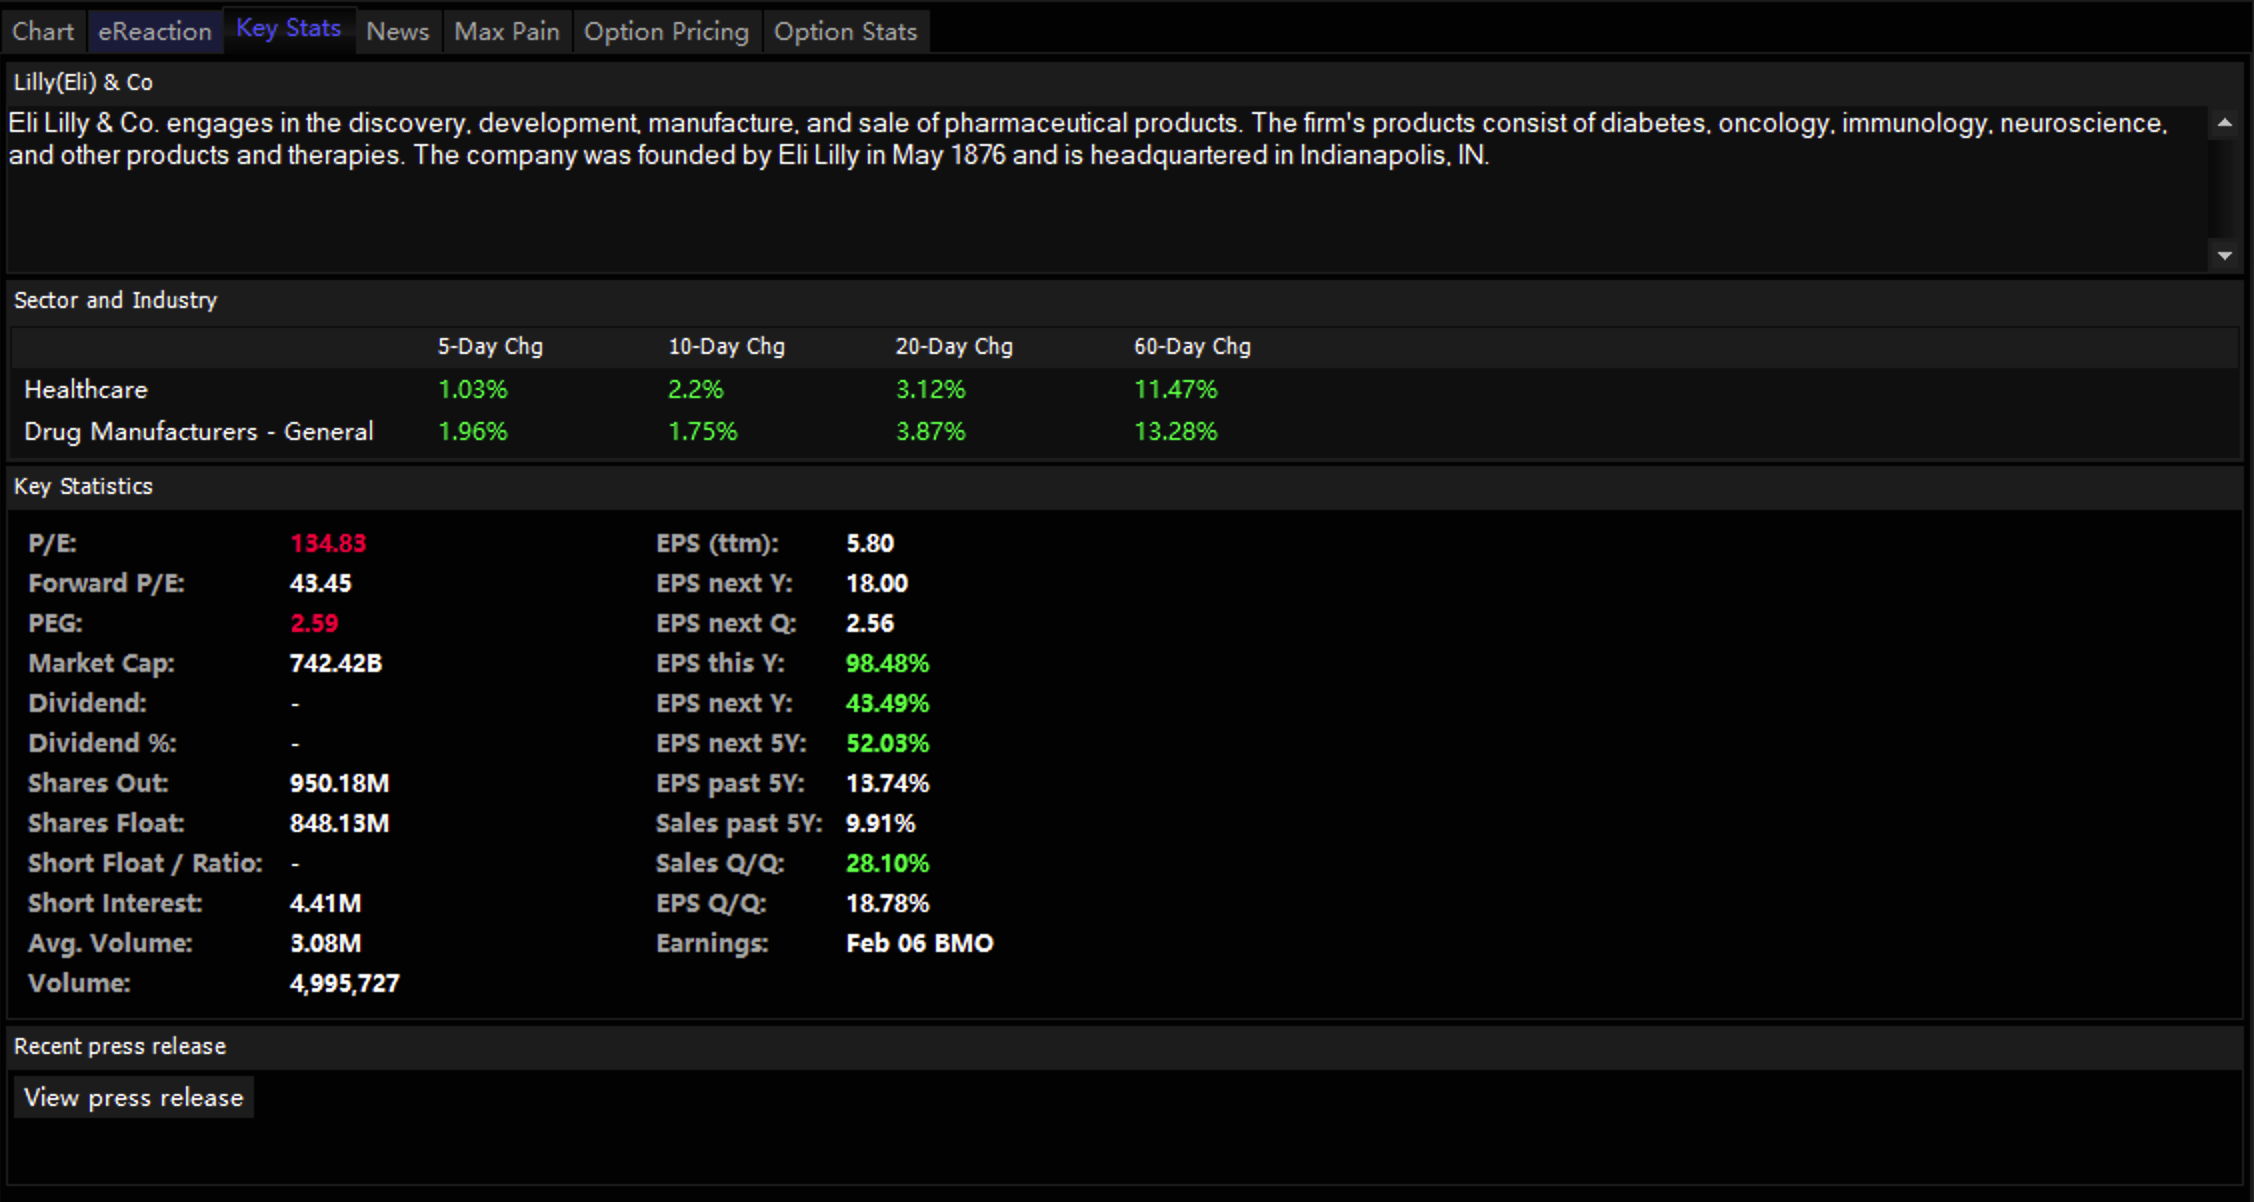
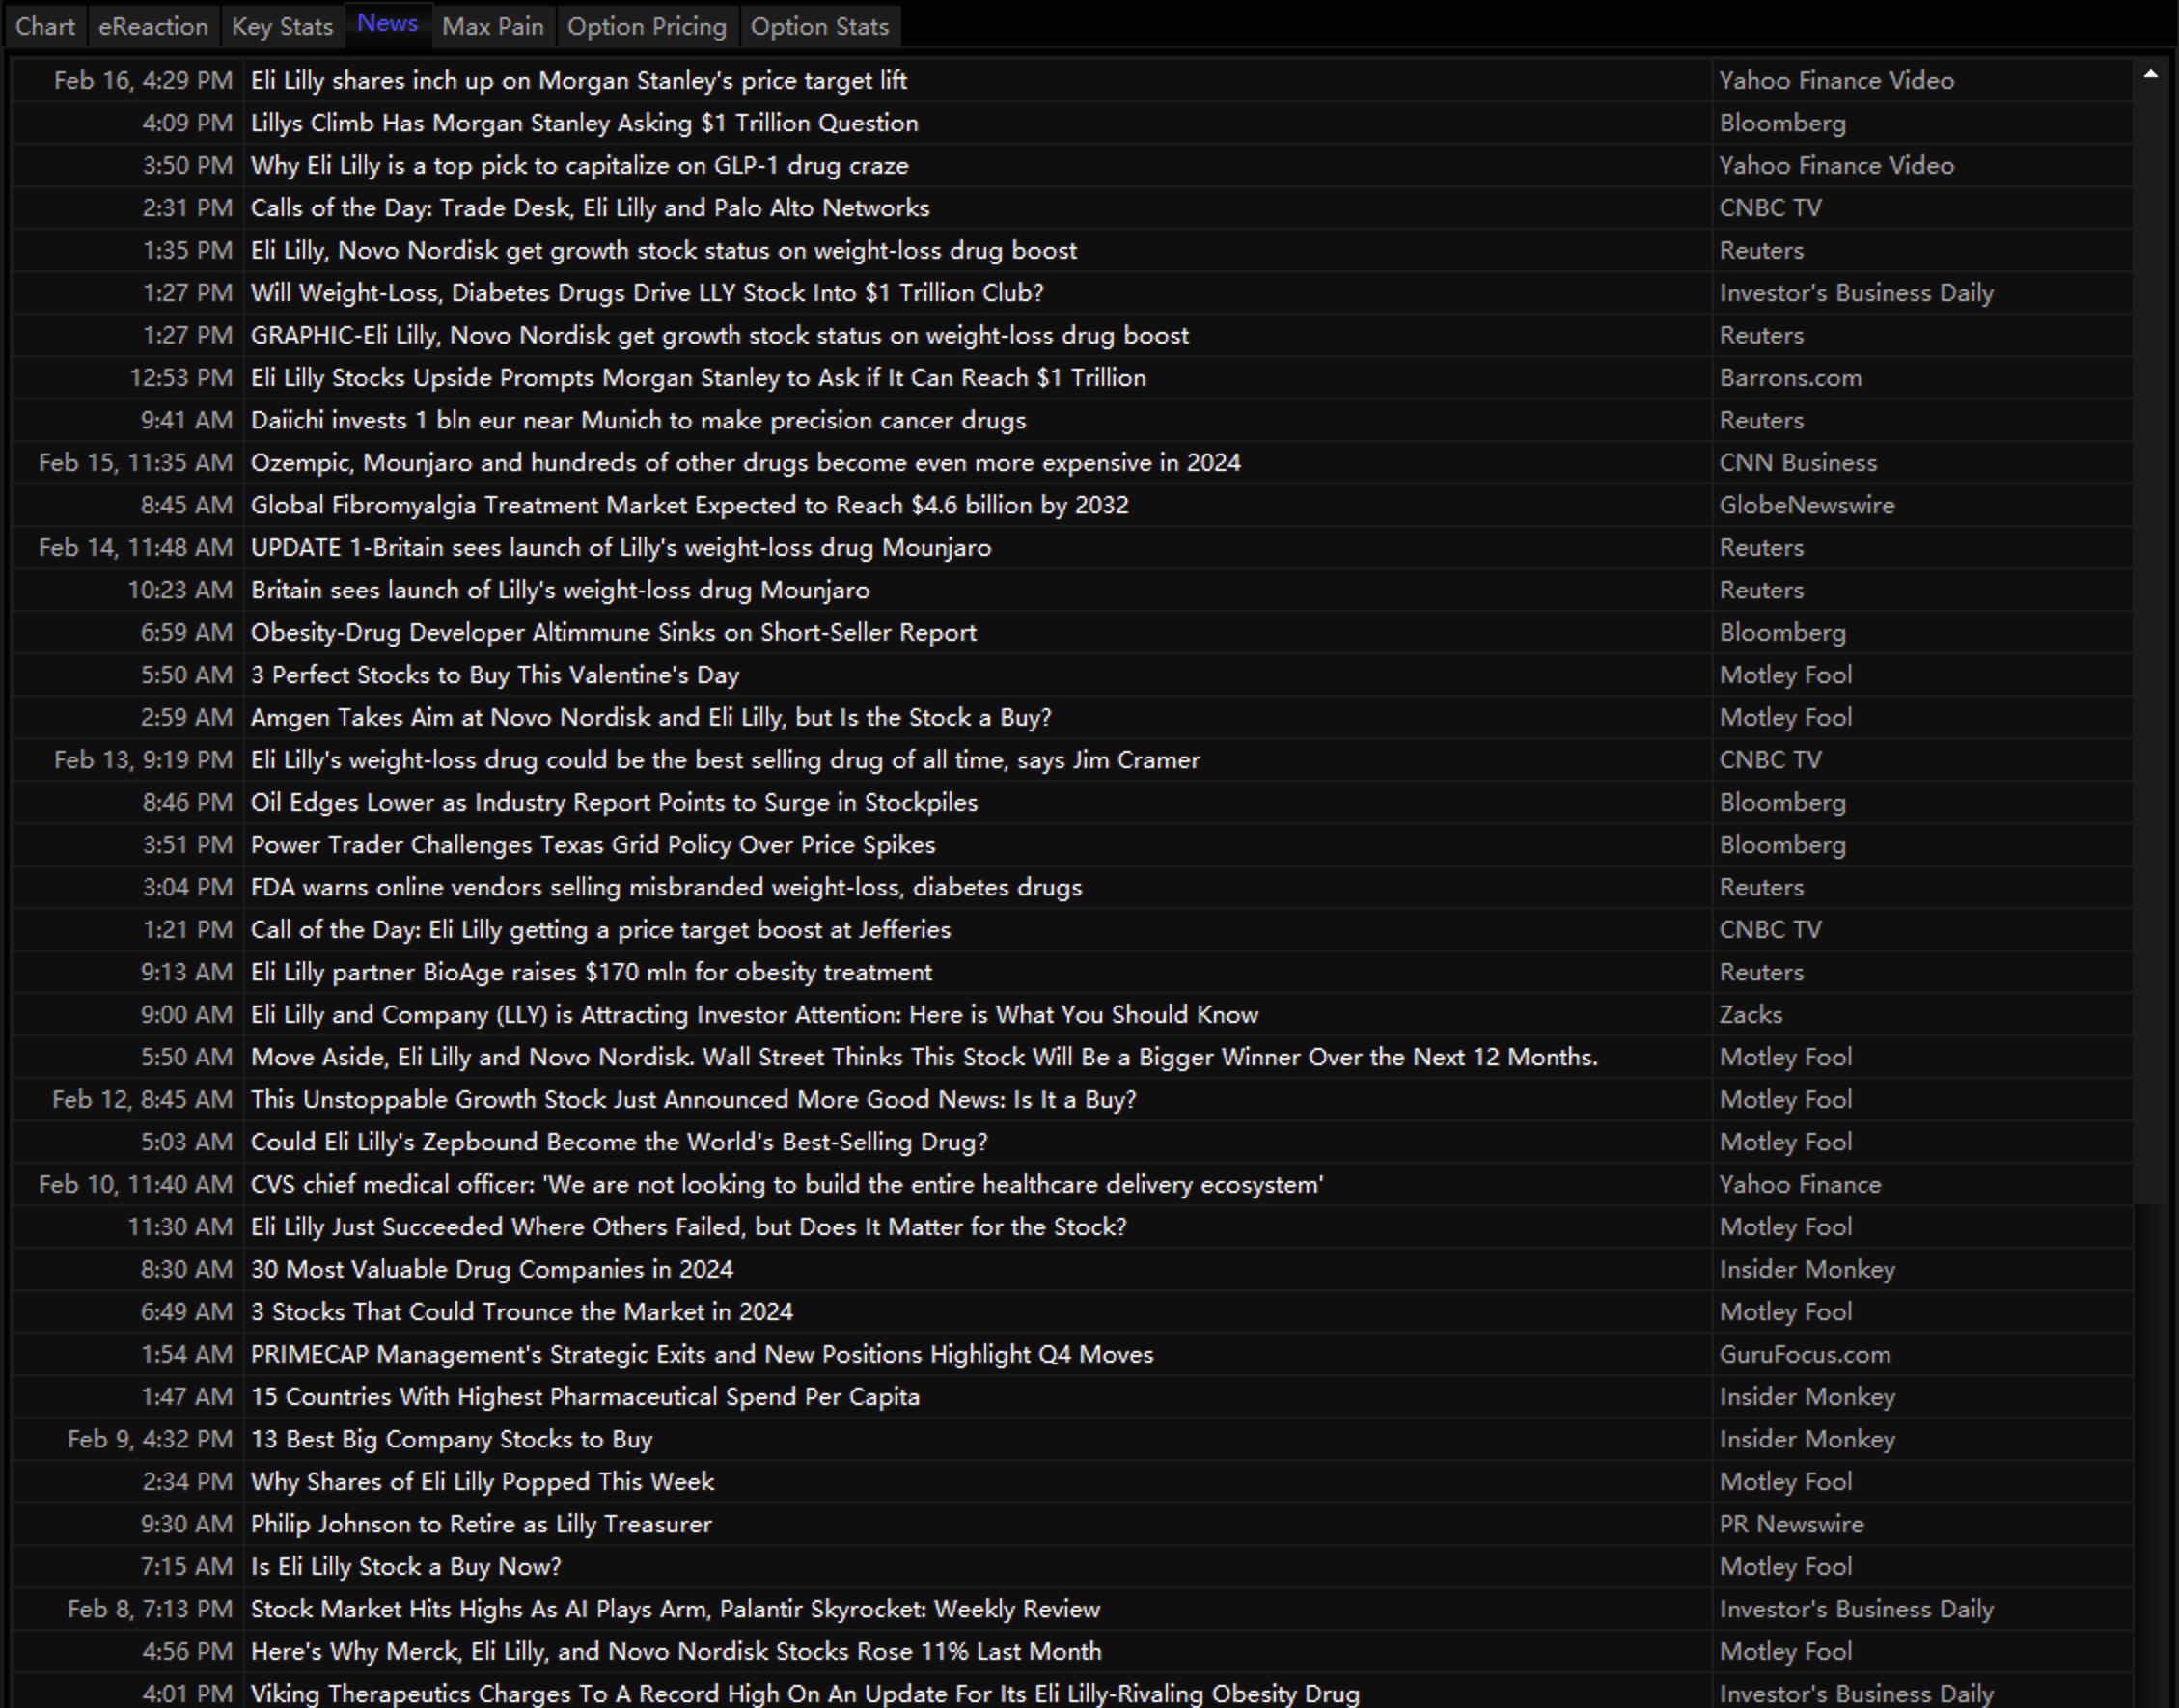
Key Stats & News
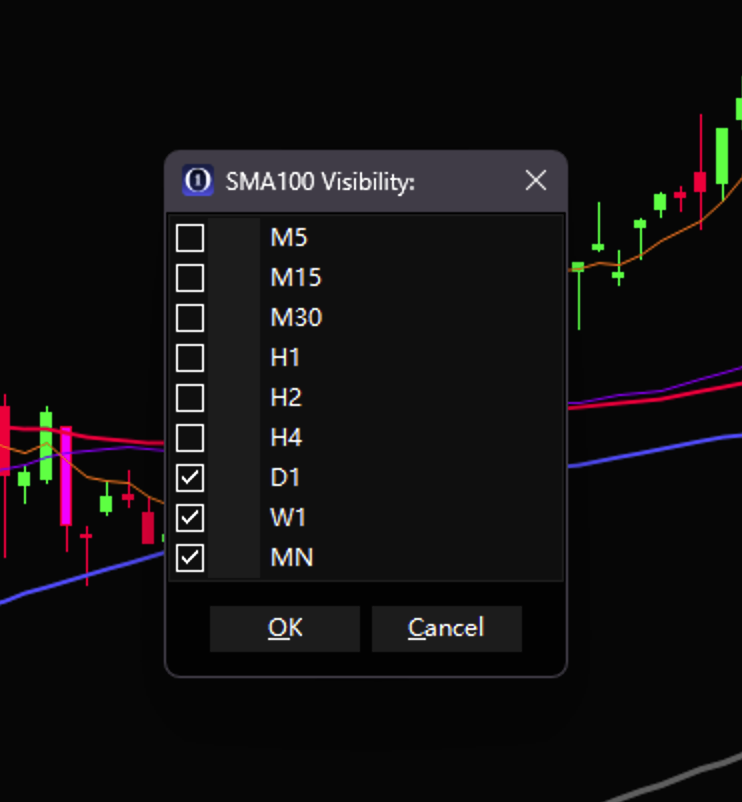
Timeframe-Specific Indicator Visibility
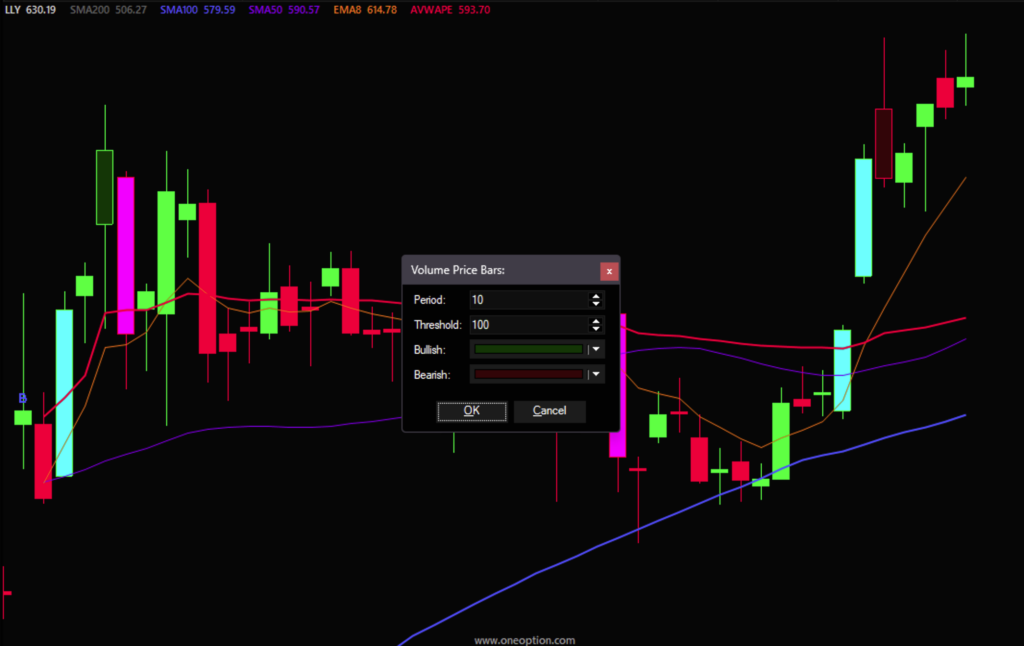
Volume Price Bars
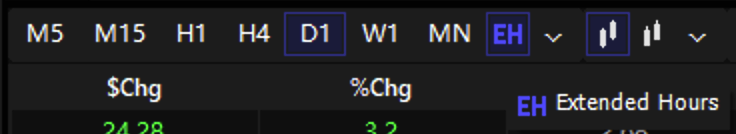
Extended Hours Button
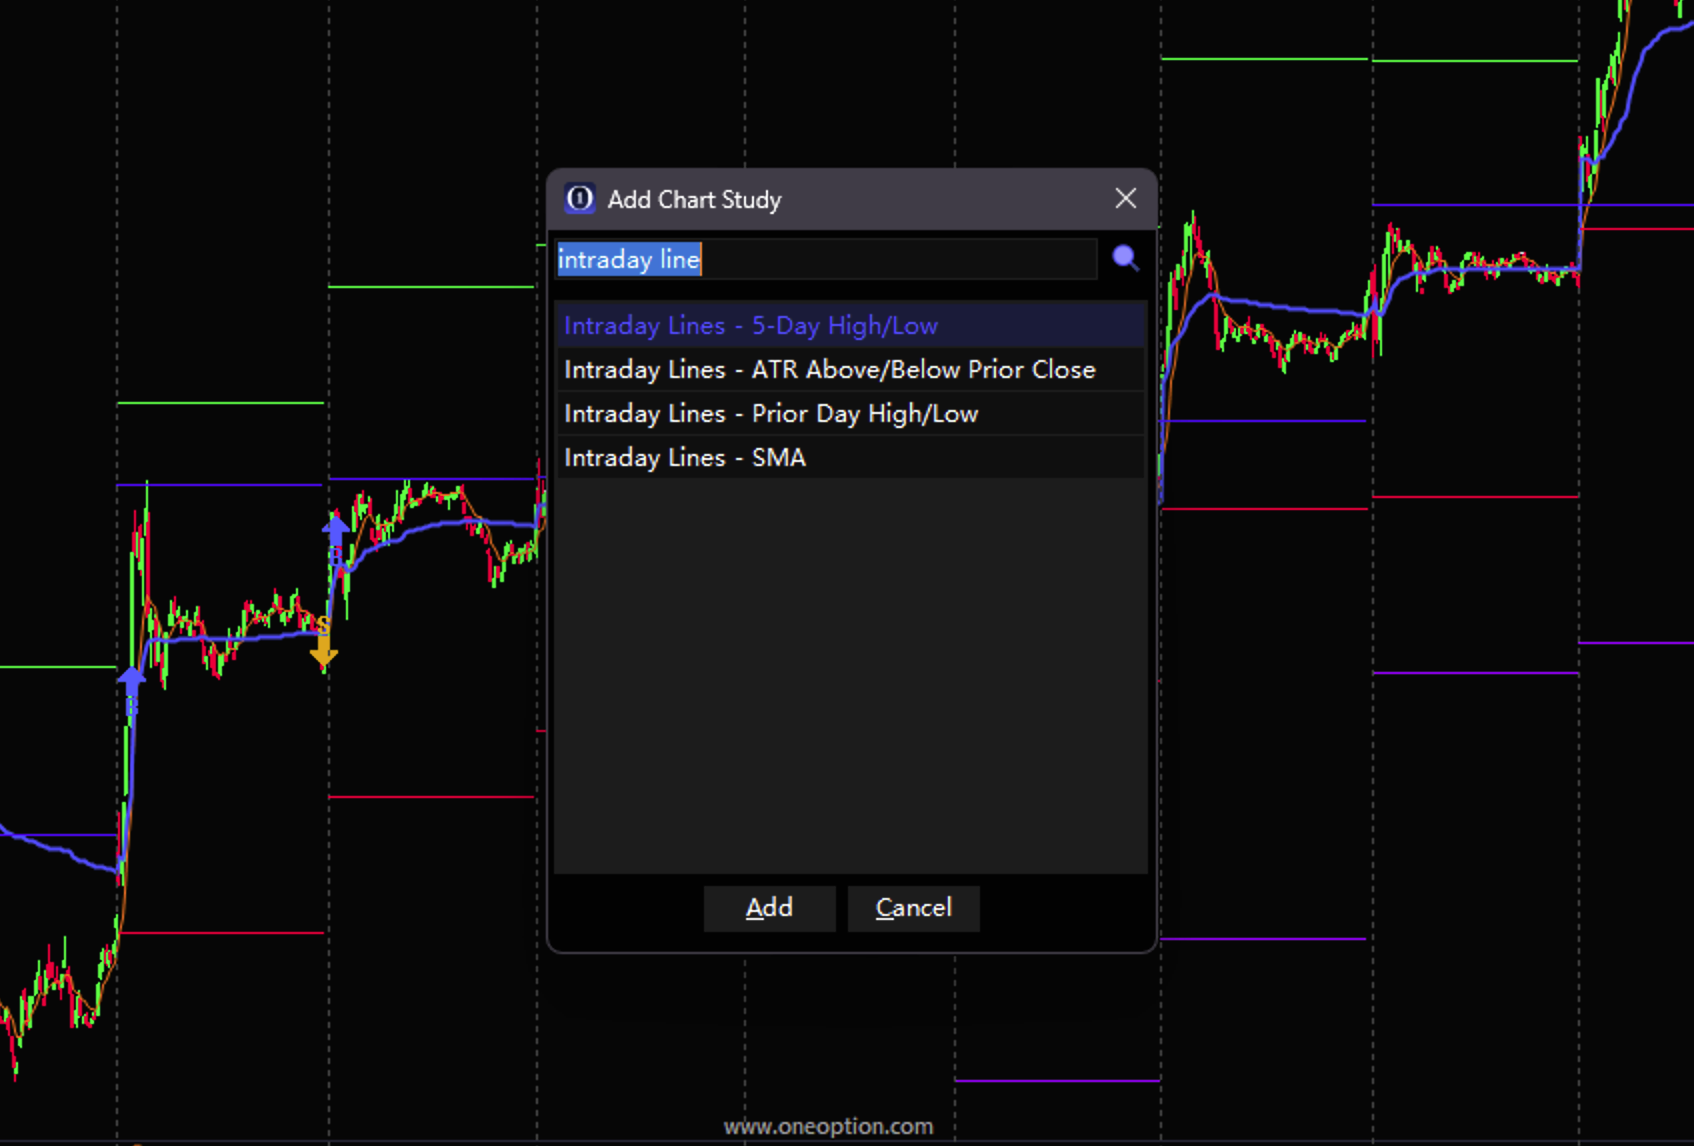
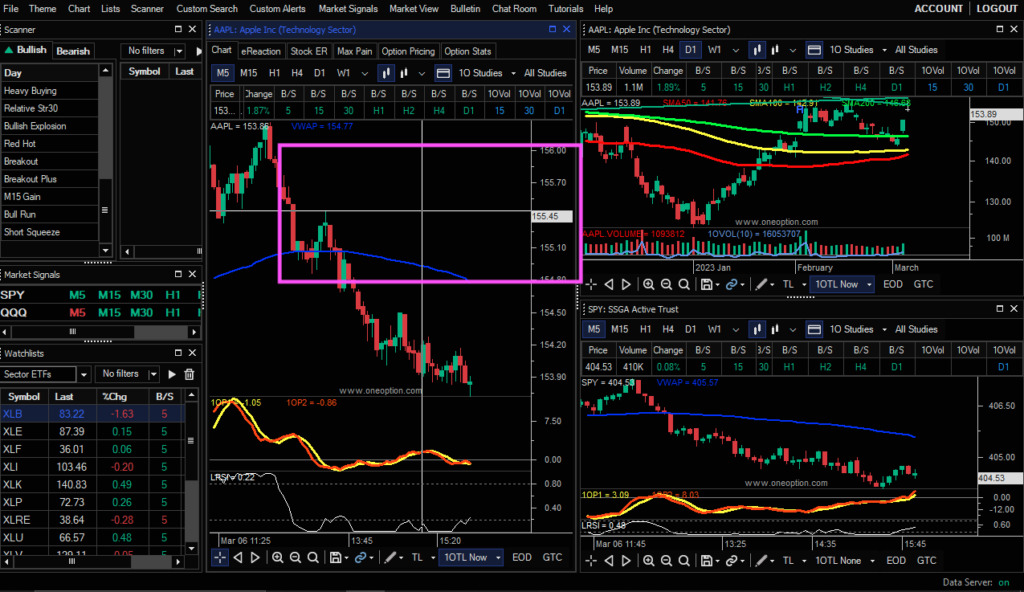
Intraday Lines Studies
1OTL and Trendline Alert Improvements
Right-Click 1OTL lines to create Trendline Alerts.October 2023
10/30/23 Patch – 1.17.4.1
- Added Shared Workspaces link in File menu
- Added ability to edit existing Watchlist symbol rows
- Added ability to edit tag watchlist
- Fixed crash during Load Workspace
- Fixed crash when changing drawing colors
- Fixed issue causing some users’ charts to not update on startup
Option Stalker Pro
We’re excited to announce the following additions to Option Stalker Pro:
- New List Columns, Alerts and Custom Scanner variables – Compression Breakout (New), SMI (New), LRSI (New), Key Bar
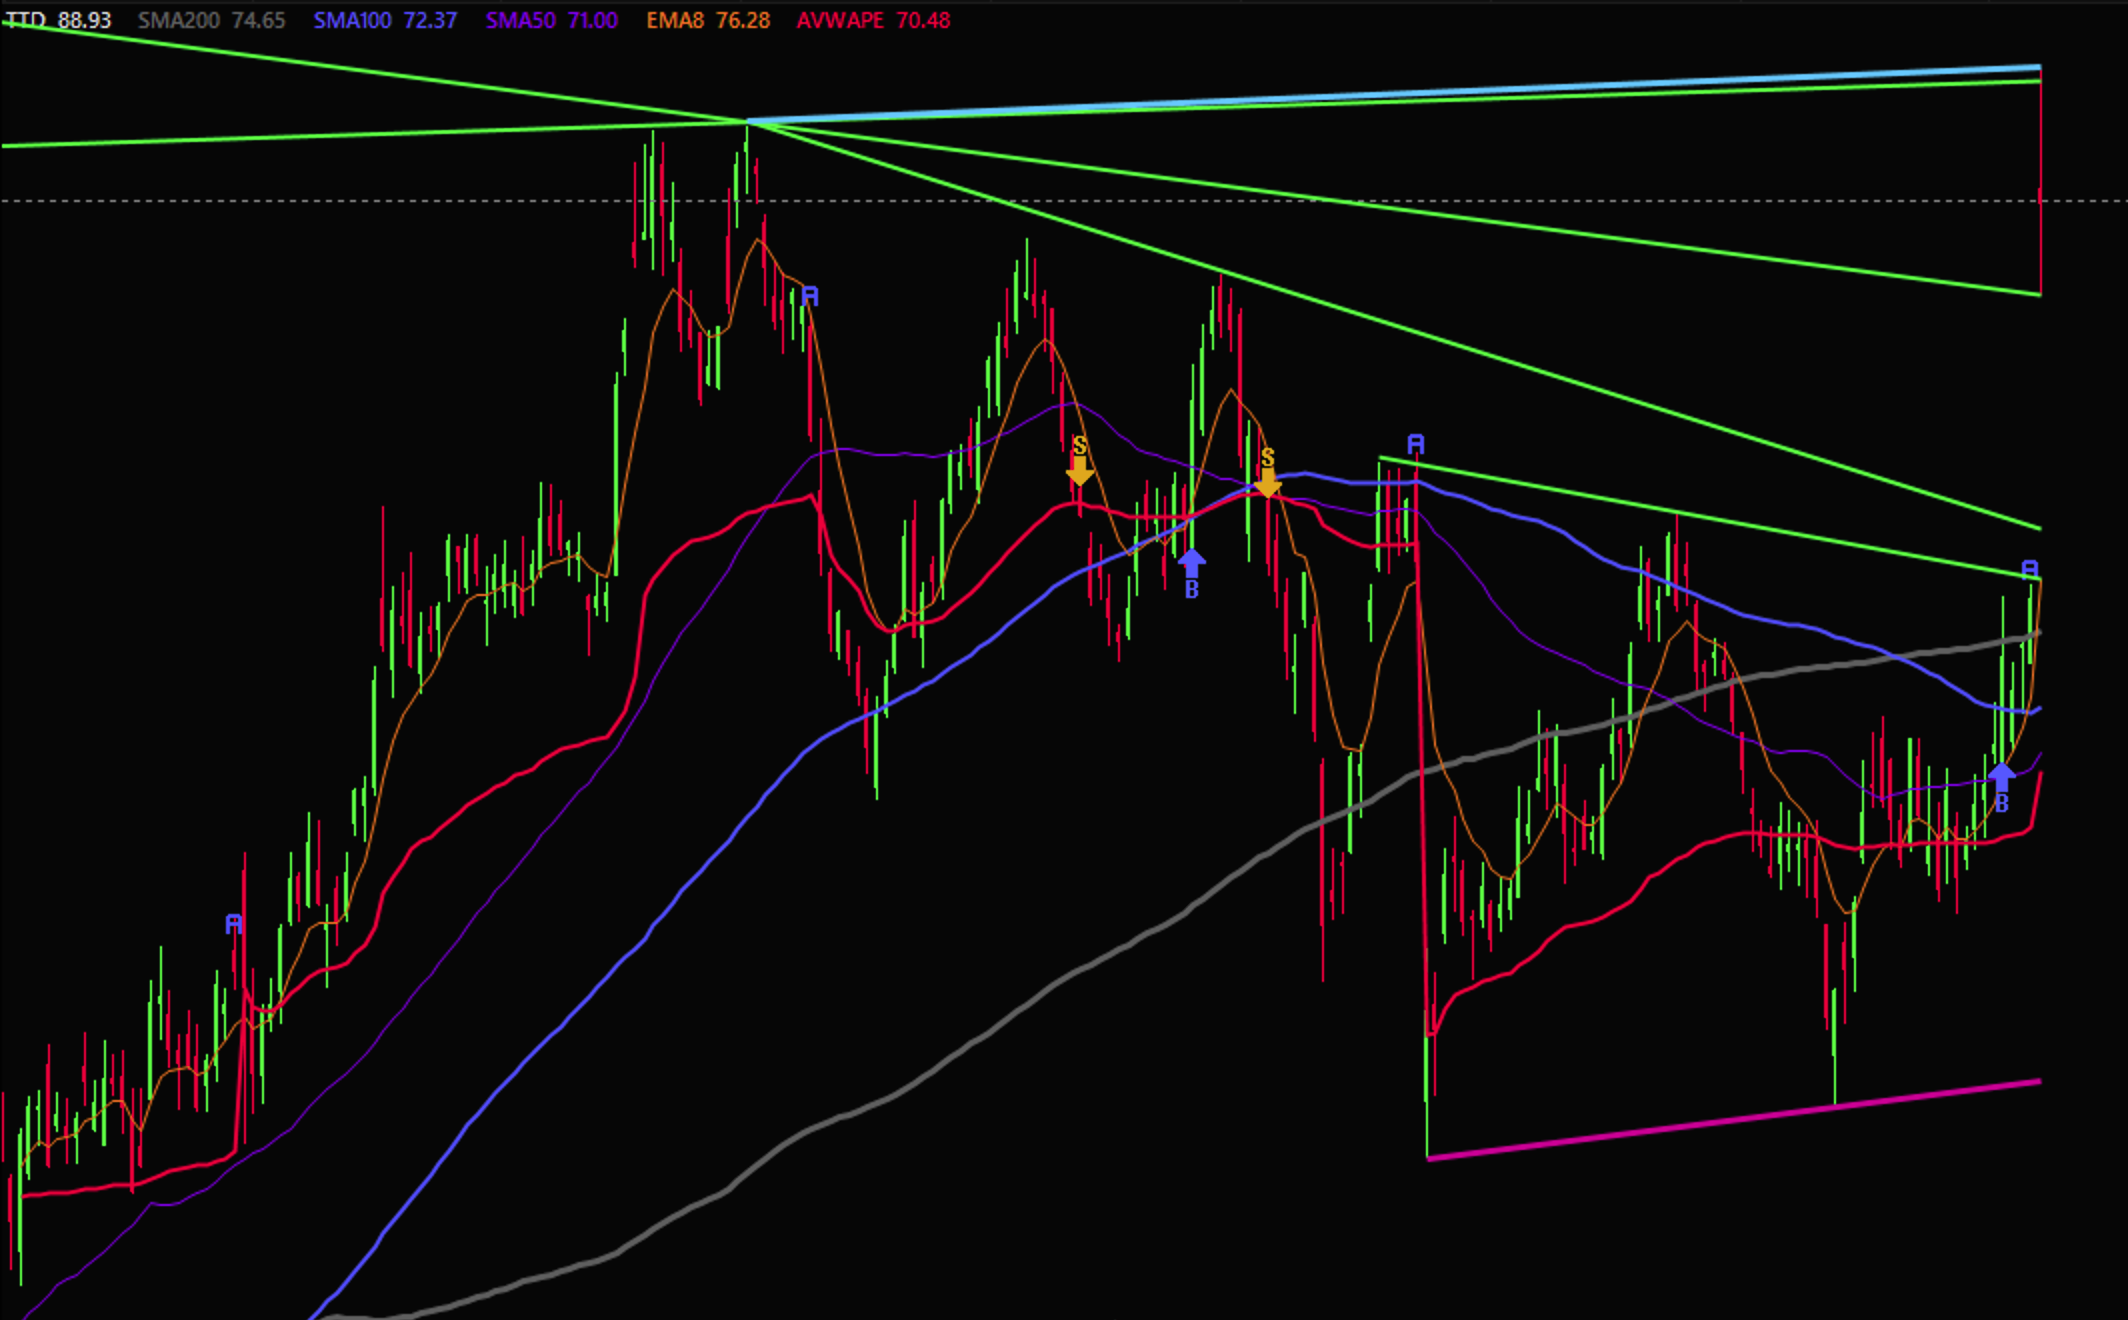
- Real Relative Strength (Sector) (RRS(s)) Chart Study – RRS(s) is now available as a Chart Study/Indicator
- Shared Workspaces – Share your OSP Workspace with the community via File > Share in OSP. View Shared Workspaces.
- Synced Horizontal Lines – Horizontal line drawings now sync across all charts and timeframes.
- List Updates – Significant enhancements to the OSP lists include:
- New Column for some above Custom Scanner variables
- $ Change Column
- Hide Price & % Change columns
- Table Header Tooltips – Hover over Table Headers to reveal description tooltips
- Show List Values – Display values for list variables when available (Via File > Settings)
- Watchlist UX Adjustments – Drag to reorder symbols in a Watchlist. Click & Hold to edit symbol.
- Table Column Reordering – Now possible on Watchlists, Scanners, and Chart HUDs
- Per-Chart HUD Columns – Individually customize the columns for Chart HUDs
Caps LockCrosshair Toggle – Crosshairs are now toggled via the CAPS LOCK and apply to all charts when active- Key Bar Custom Colors – Specify Fill Color for the Key Bar chart indicator
- New Chart Settings – Right Margin & Chart Background Color
- Advanced Color Options – Specify precise colors in all color dialogues
- Global App Settings – File > Settings displays app-wide settings.
- Export Workspace Settings – Distinct from Workspaces, these include Global App Settings and App Colors (Theme & Bear/Bull colors)
- Market Clock – Added in upper-right of App
Option Stalker (Web)
- Paper Trader – Practice your trading on OS(web) charts with Live Data using the new Paper Trader
- Chat Criteria Filter – Automatically view a Checkmark on the Charts for stocks that satisfy the minimum criteria outlined in the Chat Room Policies.
- Faster Chart Updates ⚡️ – Charts now change symbols and timeframes without reload to improve performance!
Visit www.oneoption.com/release-notes for a complete list of updates.
September 2023
We’re excited to announce the following additions to Option Stalker Pro:
- Server-Side Alerts – Alerts have been migrated to be fully hosted on the server. This ensures Alerts trigger even when OSP is not open, and paves the way for interesting features in the future.
- Updated UI & Design – We’ve made some adjustments to the general look and feel of OSP. Enjoy some new colors, design elements, & organization.
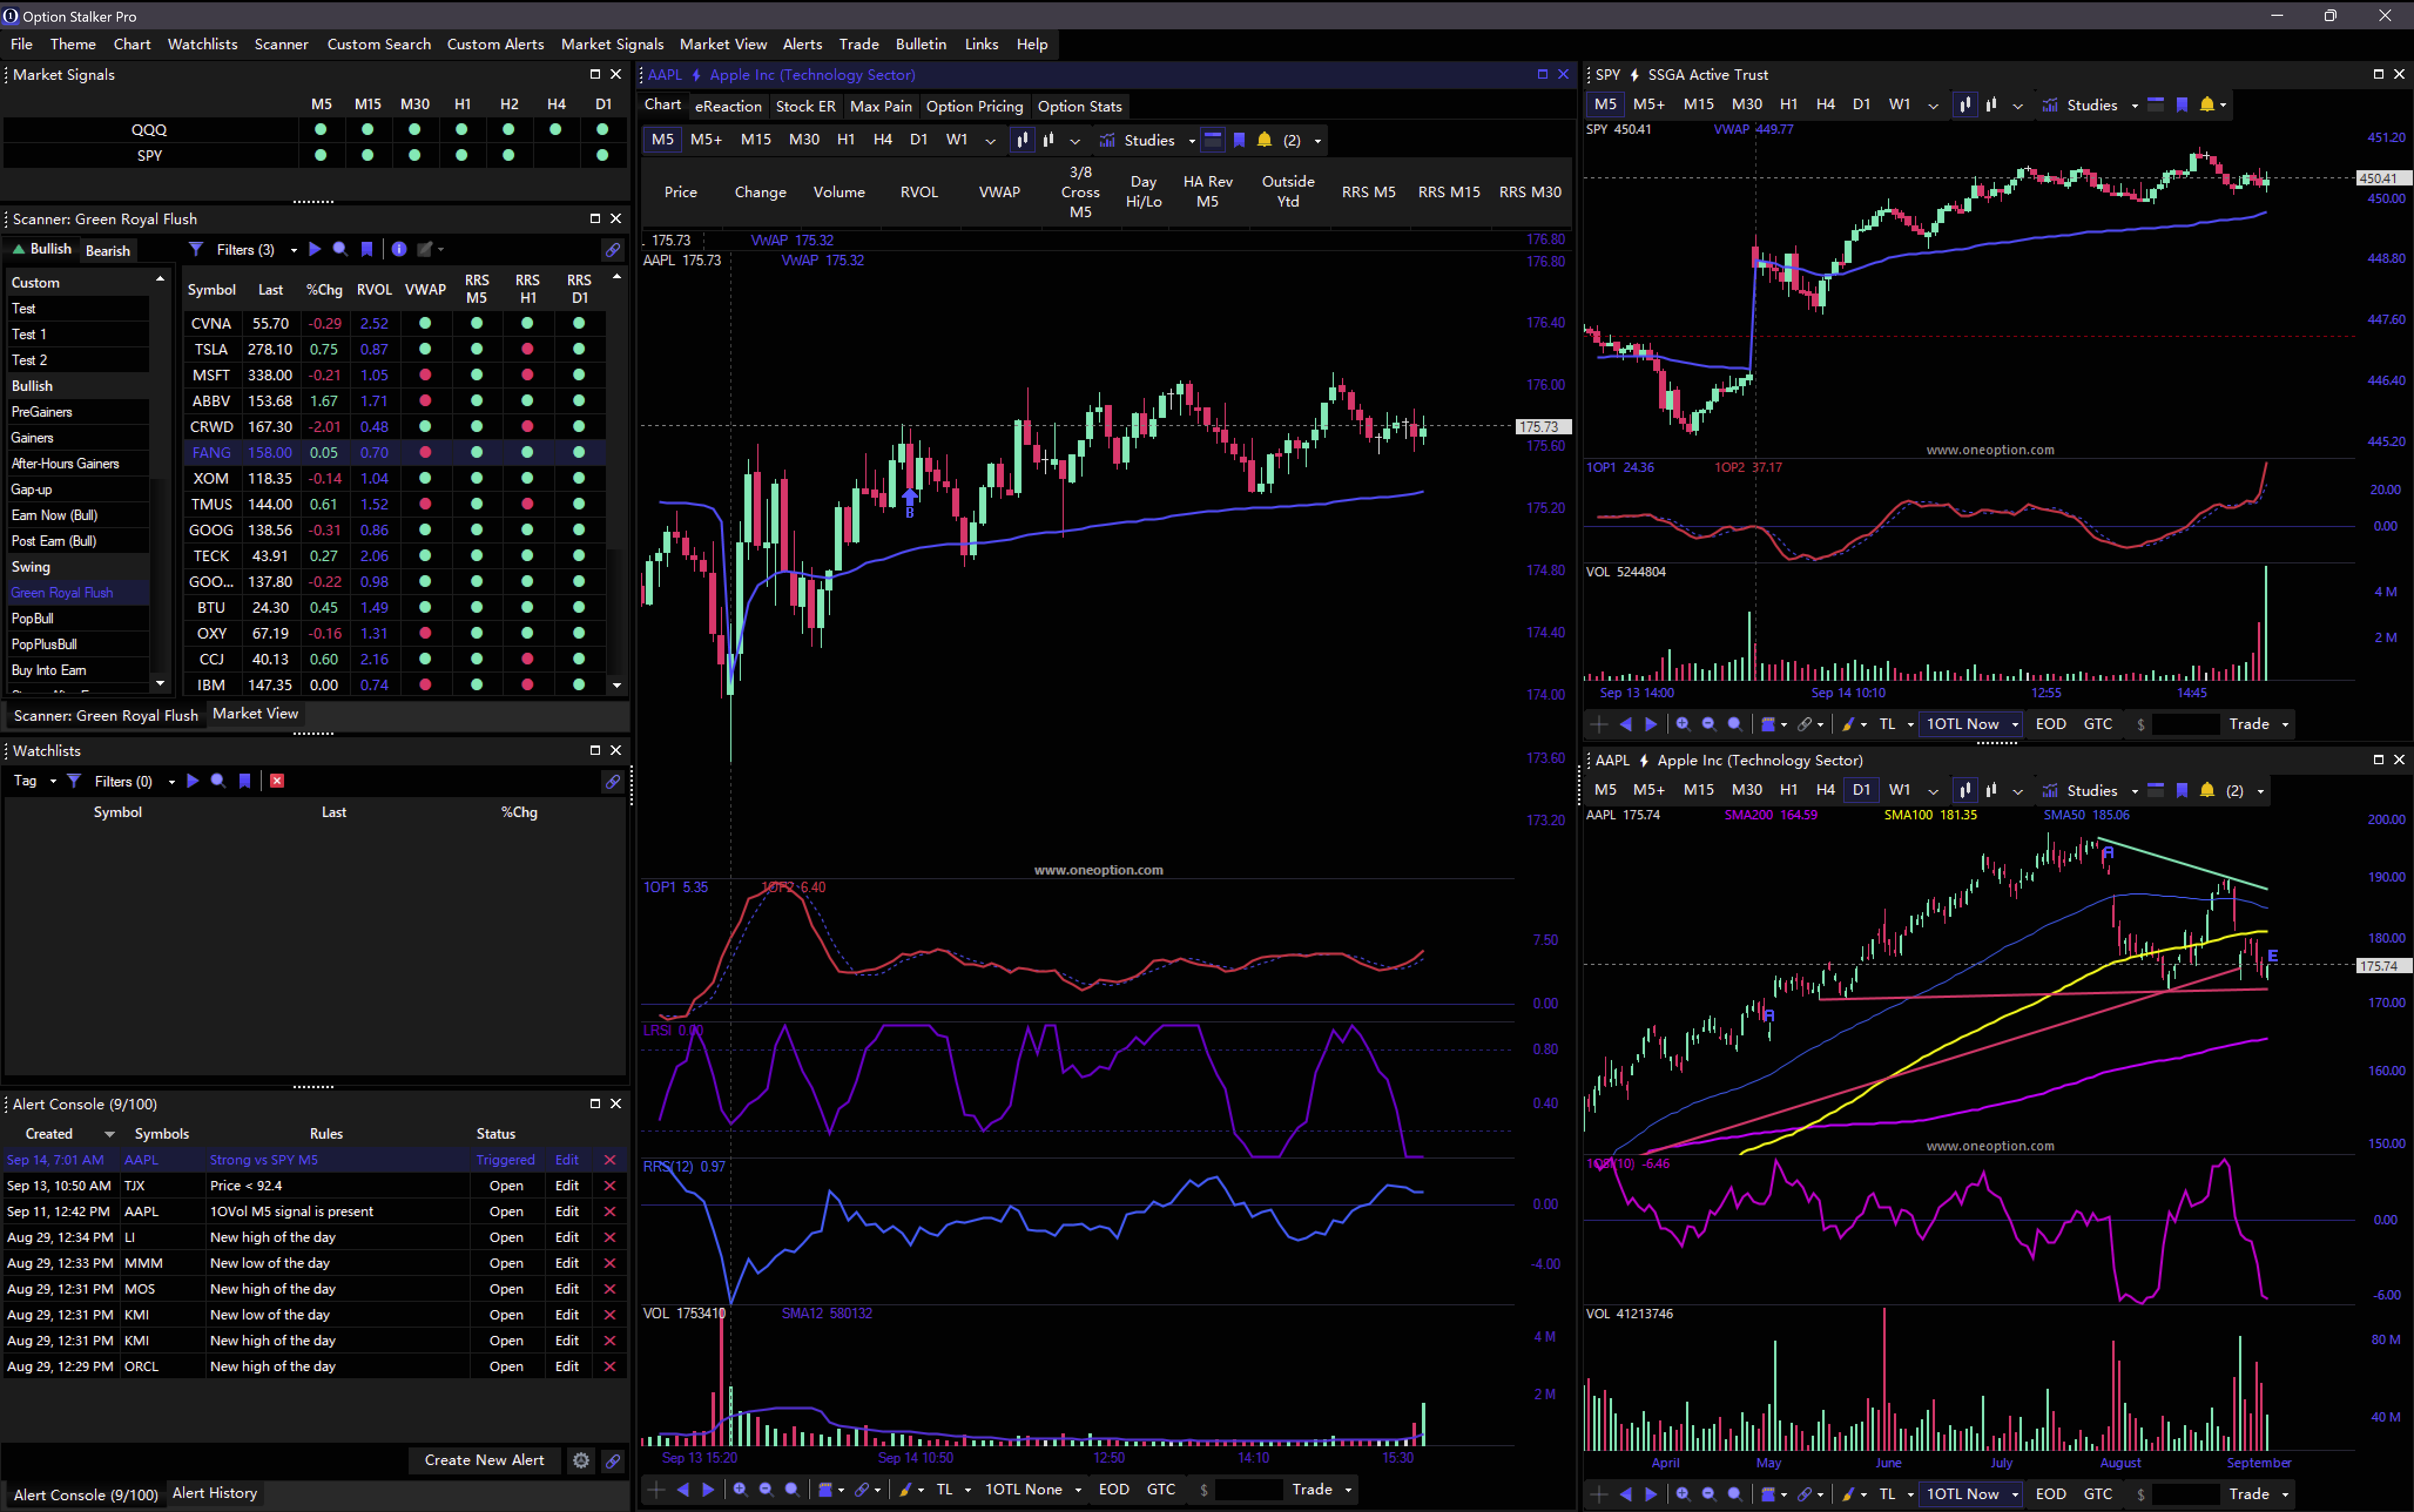
- RRS & RRV Indicators – Thanks to s/RealDayTading and @Hariseldon, we now support RealRelativeStrength and RealRelativeVolume indicators in Custom Scanners, Alerts, List Columns, and Charts
- New List Columns, Alerts and Custom Scanner variables – VWAP, 3/8 Cross, New High/Low, Outside Previous Day Range, HA Rev/Cont, Heavy Volume, RVOL
- Saved Workspace Enhancements – Auto-save your workspace, Save multiple Workspaces, and Import/Export to Share.
- Chart Settings – Edit fonts, margins, axis intervals, and colors via
Right-clickon chart - Updated Chart Library – New mouse wheel interactions, visible range settings, and y-axis adjustment abilities.
Visit www.oneoption.com/release-notes for a complete list of updates.,
Enjoy the new look and feel of OSP with new icons, colors, menu organization, and other small design adjustments
Updated UI & Design
RealRelativeStrength & RealRelativeVolume
We’re excited to expand OSP’s capabilities to help you trade Relative Strength & Weakness (RS/RW) with the the inclusion of RRS & RRV indicators in our lists, scanners and charting.
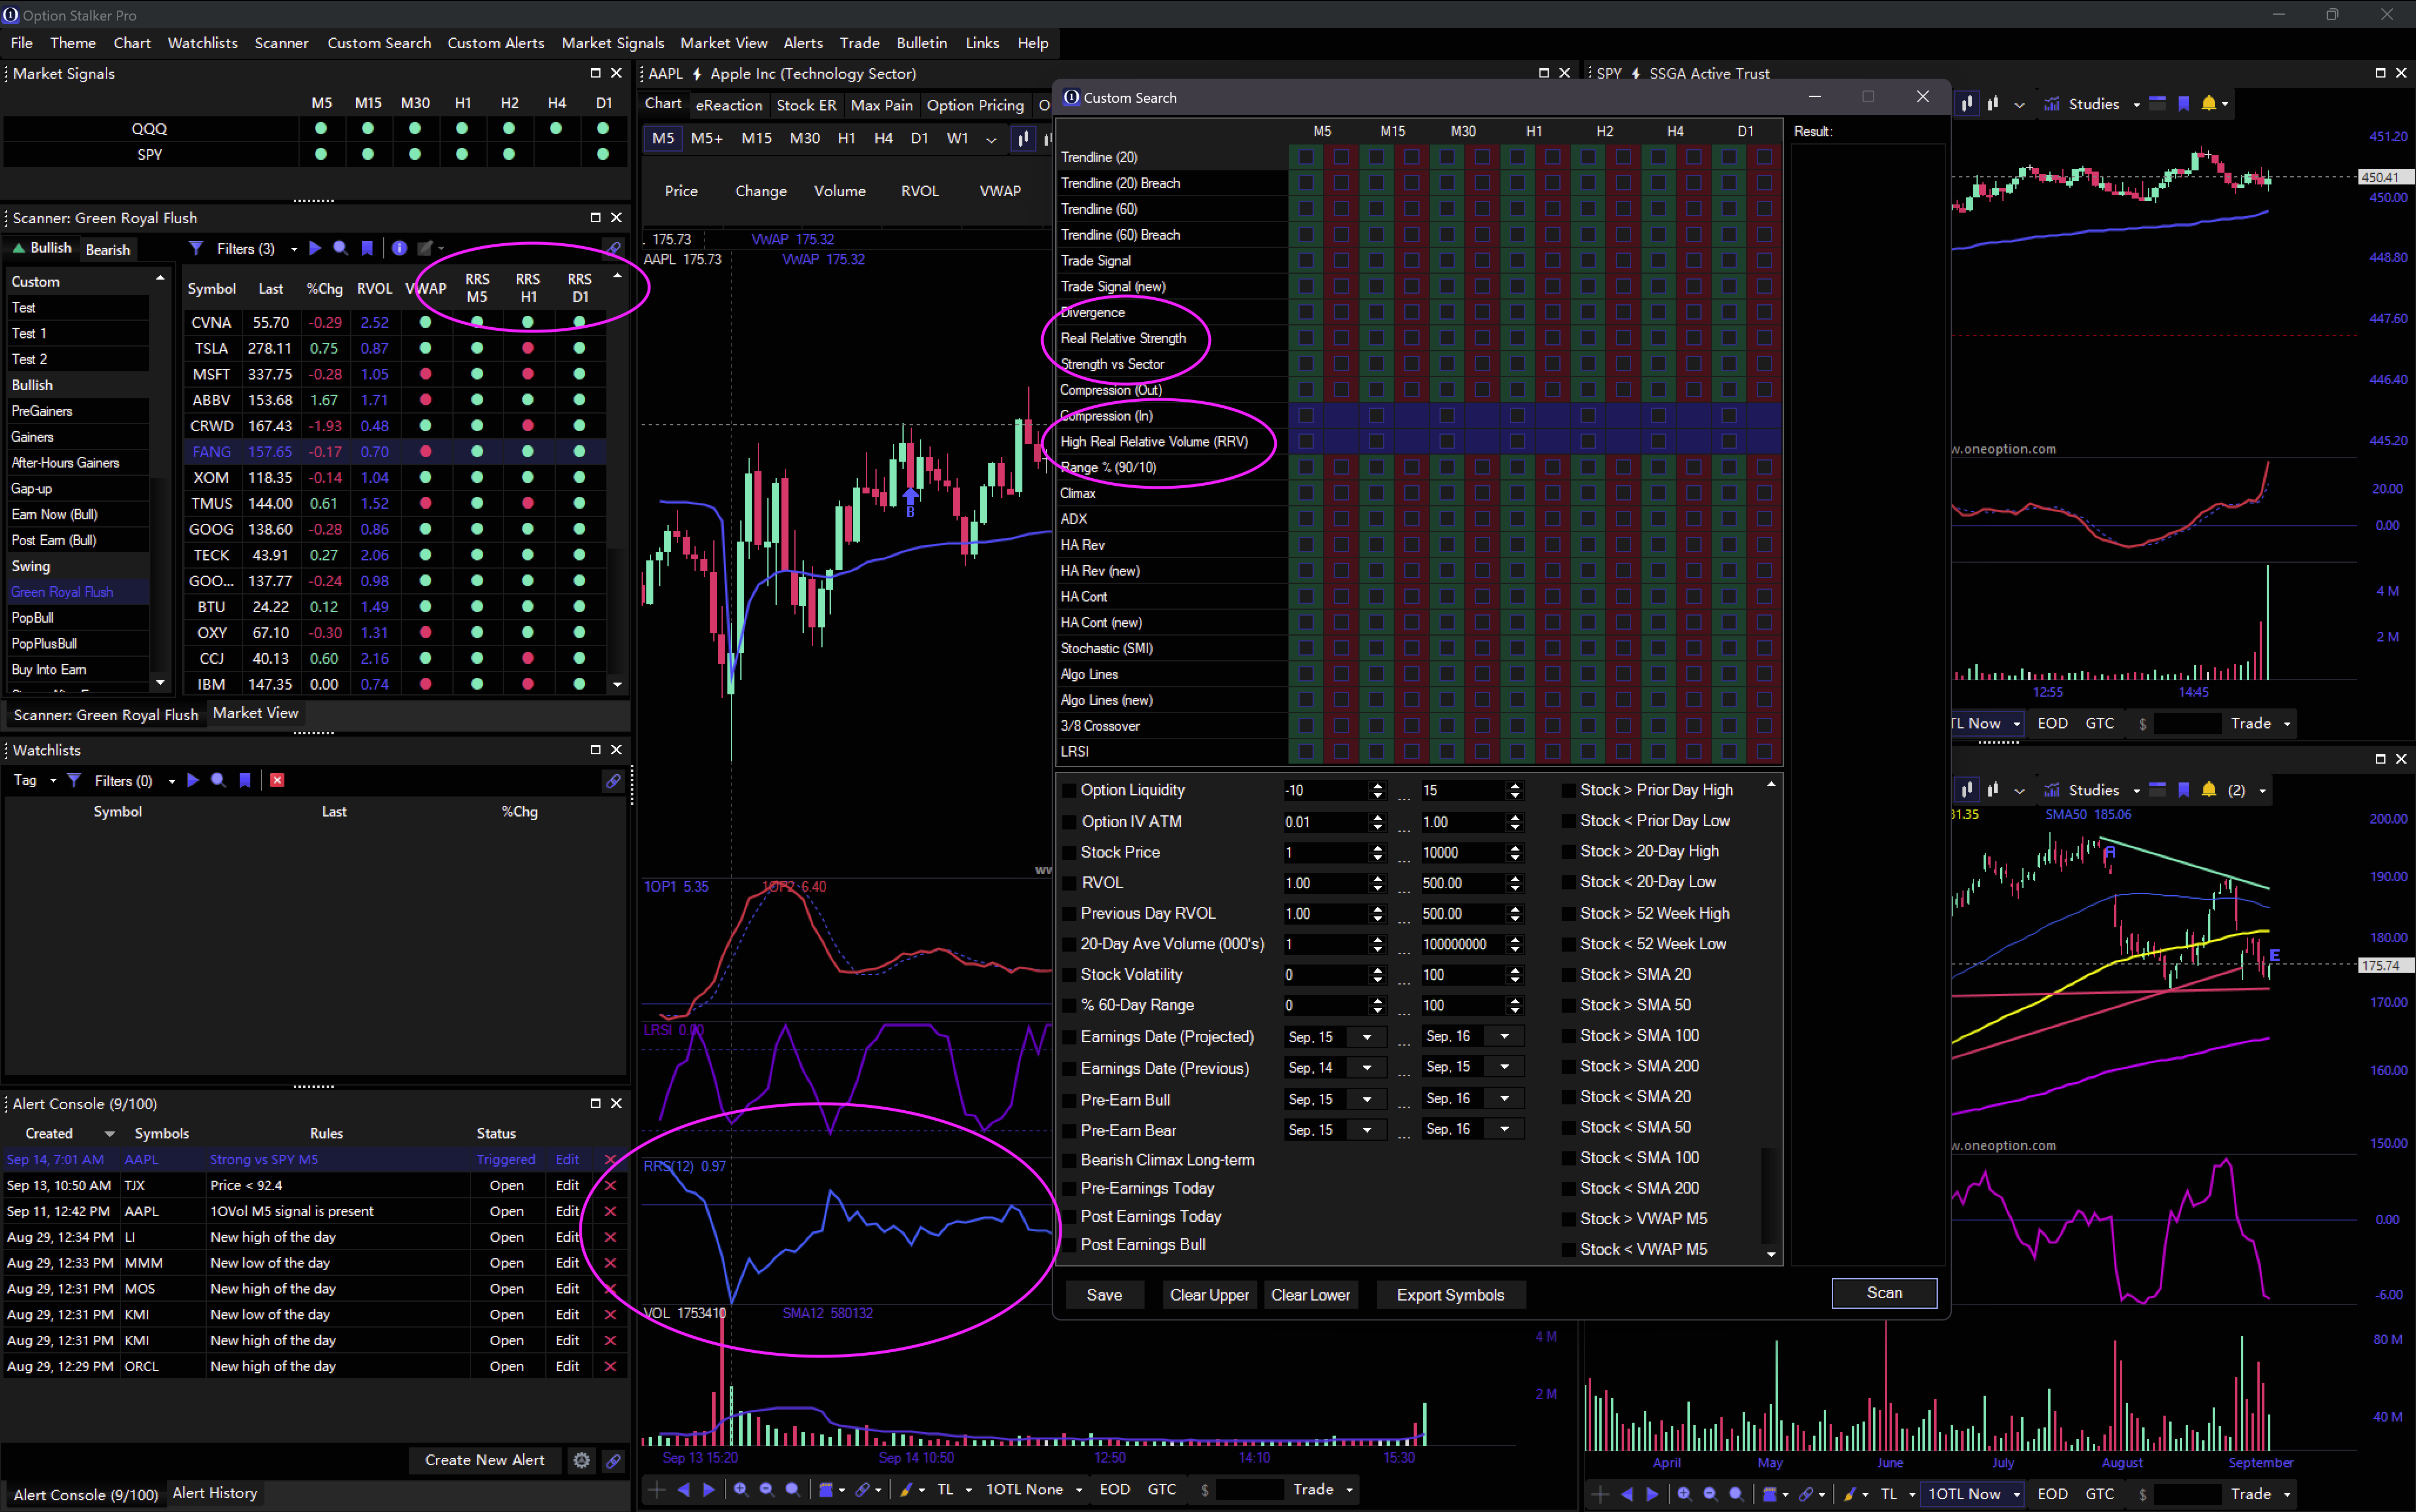
New List, Alert, and Custom Search Variables
The list of available variables for list columns, alerts and Custom Scanner/Search variables has expanded. They now include
- VWAP (Above/Below)
- 3/8 Cross (Bullish/Bearish, timeframe specific)
- New High/Low
- Above/Below Previous Day Range
- Heikin Ashi (HA) Reversal/Continuation
- Heavy Volume (Using RRV, timeframe specific)
- RVOL
Workspace Enhancements
The Saved Workspace feature has had some significant improvements. Not only can you now save multiple workspaces on the same computer, you can also choose to Auto-Save your workspace and Import/Export your workspace files to share them with traders or migrate your workspace between machines.
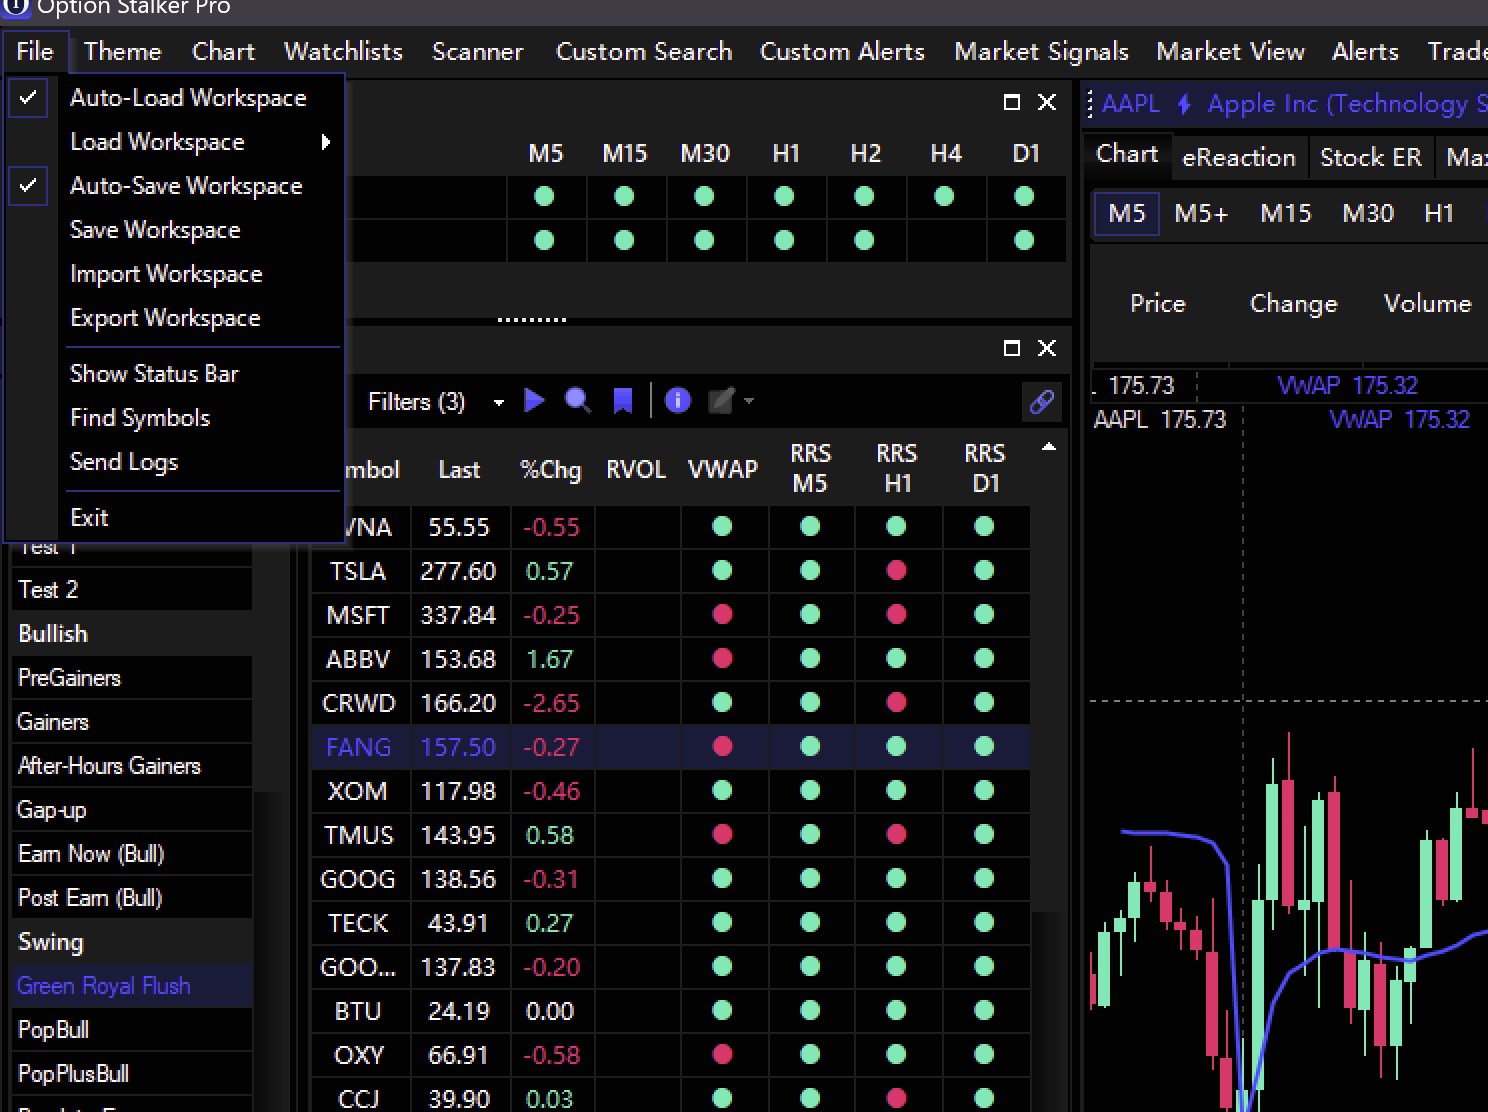
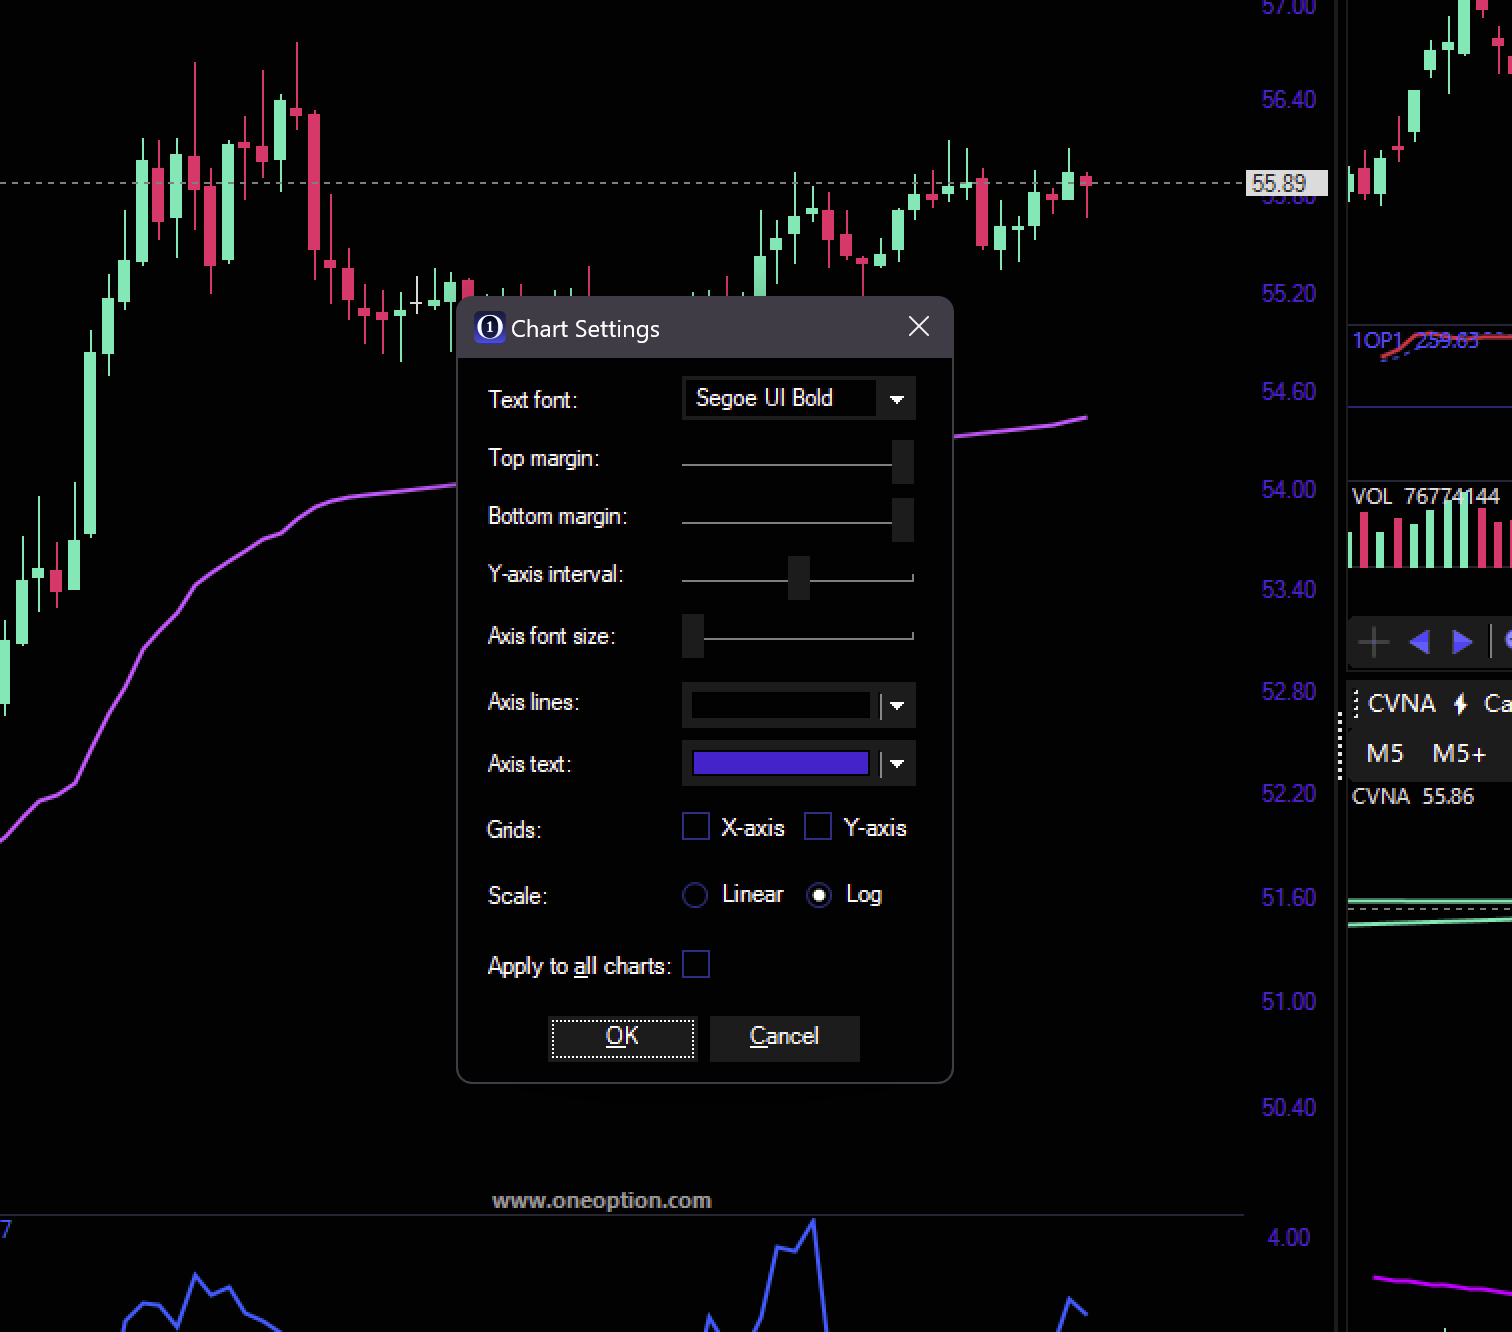
Chart Settings
Now you have more customizability for your charts. Right-click the chart area to access Chart Settings and adjust Chart Axis Colors, Fonts, Interval size, Top/Bottom margins, and other settings.
Updated Chart Library
We’ve included some other updates to the charting library:
- New mouse wheel zoom & scroll interactions
- Enabled y-axis adjustments in Log charts and charts with secondary series (like SPY Overlay)
- Chart visible range is no longer expanded by indicators (such as SMAs)
May 2023
Option Stalker Pro
The following features compose Phase 1 of the new alert system that will be further rolled out this year. In this update you will find:
- New Alerts Rules – Create alerts with trigger rules for Price, Strength vs Spy, LRSI, Trade Signal, 1OVol, and Daily SMA crosses.
- Multi-Rule Alerts – Use these alert values in any combination to create multi-rule alerts.
- Alert History – All triggered alerts are now listed in a single panel.
- Alert Console – Review, edit, and delete all alerts, triggered and open, in the Alert Console.
- Extended Table Columns – Table columns in Scanners, Watchlists, and Chart HUDs are now customizable to include the above indicator values (Strength vs SPY, LRSI, Trade Signal, 1OVol, and the SMAs).
- Quick Alert Creation –
Right-Clicktable cells and charts to quickly create alerts. - Crosshair performance improvements including: Auto-hide crosshair when cursor leaves chart area.
ESCto cancel Zoom – PressingESCnow cancels the blue Zoom-In interaction
This is a very new release — please let us know if you find any issue! You can email Will at [email protected]
Visit www.oneoption.com/release-notes for a complete list of updates.
New Alert Conditions
This update is the start of a larger project that integrates Custom Scanner variables, Table Column Options, and Alert Rules. We have started with several highly-requested values: Strength vs SPY, LRSI, Trade Signal, 1OVol, SMAs, and of course simple Price Alerts. These values, which are calculated on the server, are the same used as variables in the Custom Scanner. Now, you can create alerts with these values and use theme as columns in your Scanner, Watchlist and HUD tables. We will roll out more variables as the year goes on. Please let us know what you think!
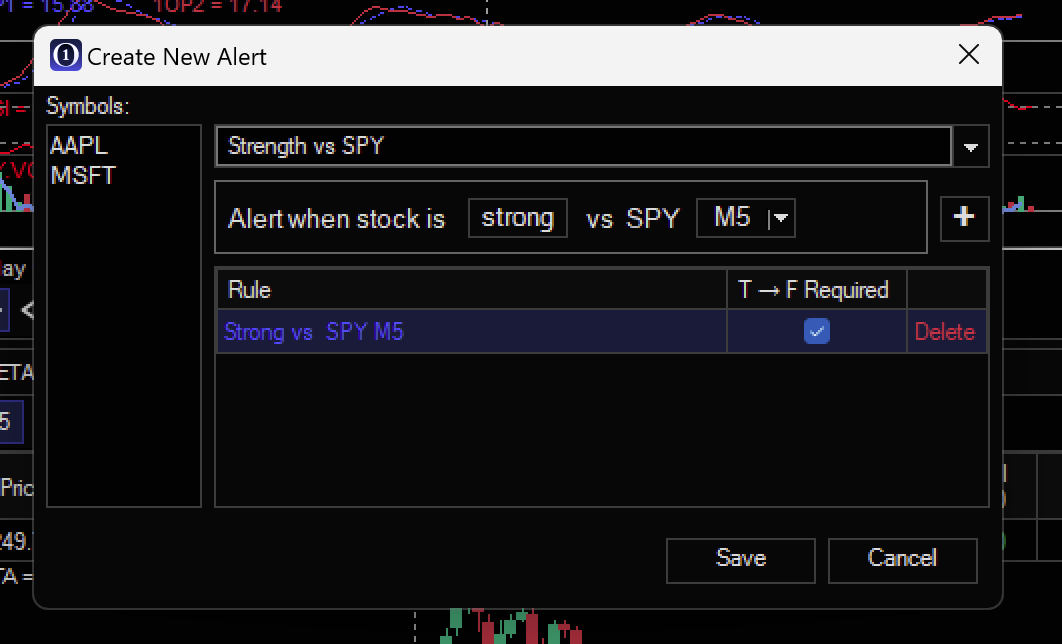
Alerts can quickly be created for more than one symbol. Seen here is the Create New Alert window showing an alert being created for AAPL and MSFT. This alert will trigger when the variable Strength vs SPY goes from < 0 to > 0.
The T-> F Required checkbox allows you to set alerts even if the trigger rule is already TRUE. If it is checked, any TRUE alerts will not immediately trigger, and instead will wait for the rule to become FALSE and return to TRUE.
Multi-Rule Alerts
Alerts rules can be combined to create a single alert which triggers only when all the rules are TRUE. This advanced feature allows for fine-tuned alerts enhance your ability to find trades exactly when conditions align.
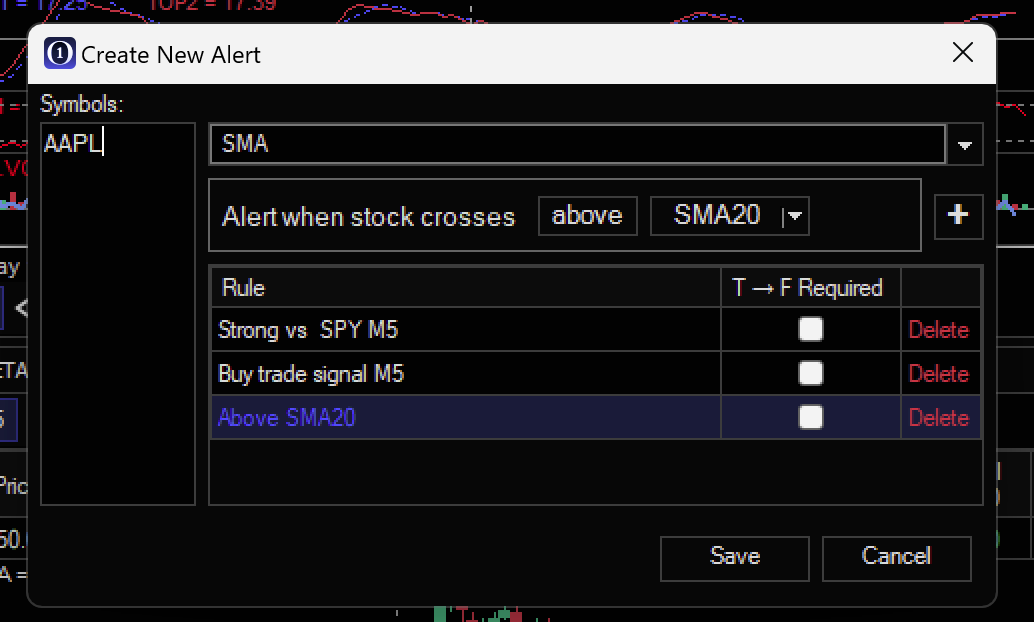
This alert will trigger when AAPL is Strong vs SPY on the 5m chart, has a BUY signal on the 5m chart, and is above the daily SMA20.
Alert History
With so many new alerts, the popups can quickly become an annoyance. Instead, you can now view all your triggered alerts in a single panel. This panel will nest in your Workspace. There is an added benefit to this: Your triggered alert history is now easily visible so you won’t forget alerts that trigger!
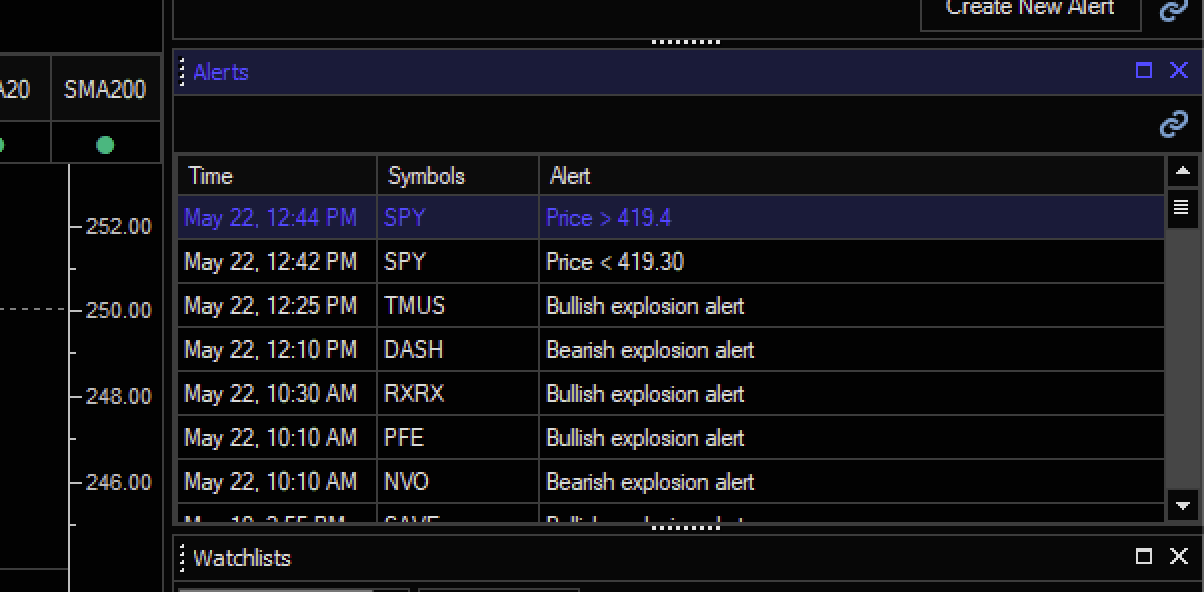
Alert History shows triggered alert history. Click a symbol in this panel to open the chart.
Alert Console
The Alerts Console is a similar list that shows both Triggered and Open alerts. Here, you can Edit and Delete alerts. Right-Click Alert Console table area to remove alerts. You can select multiple rows at once using CTRL or Shift. Click the Settings button to adjust Alert Settings.
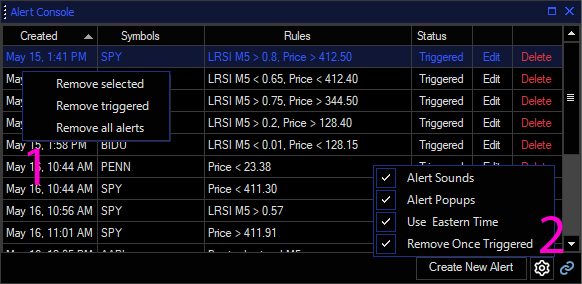
Create, Edit, and Delete alerts in the Alert Console. Columns are resizable, and you can sort the list by clicking Column Headers. (1) Right-Click rows to remove. (2) Use the gear icon to adjust global alert settings.
Extended Table Columns
The variables offered with Alerts are now also available as customizable table columns. Right-Click the table headers in Scanners, Watchlists, and Chart HUDs to edit columns and select Trade Signal (B/S), Strength vs SPY, LRSI and 1OVol for any timeframe and daily SMAs. You can save these columns with your Workspace. These columns reflect server values used for Custom Search and refresh every minute.
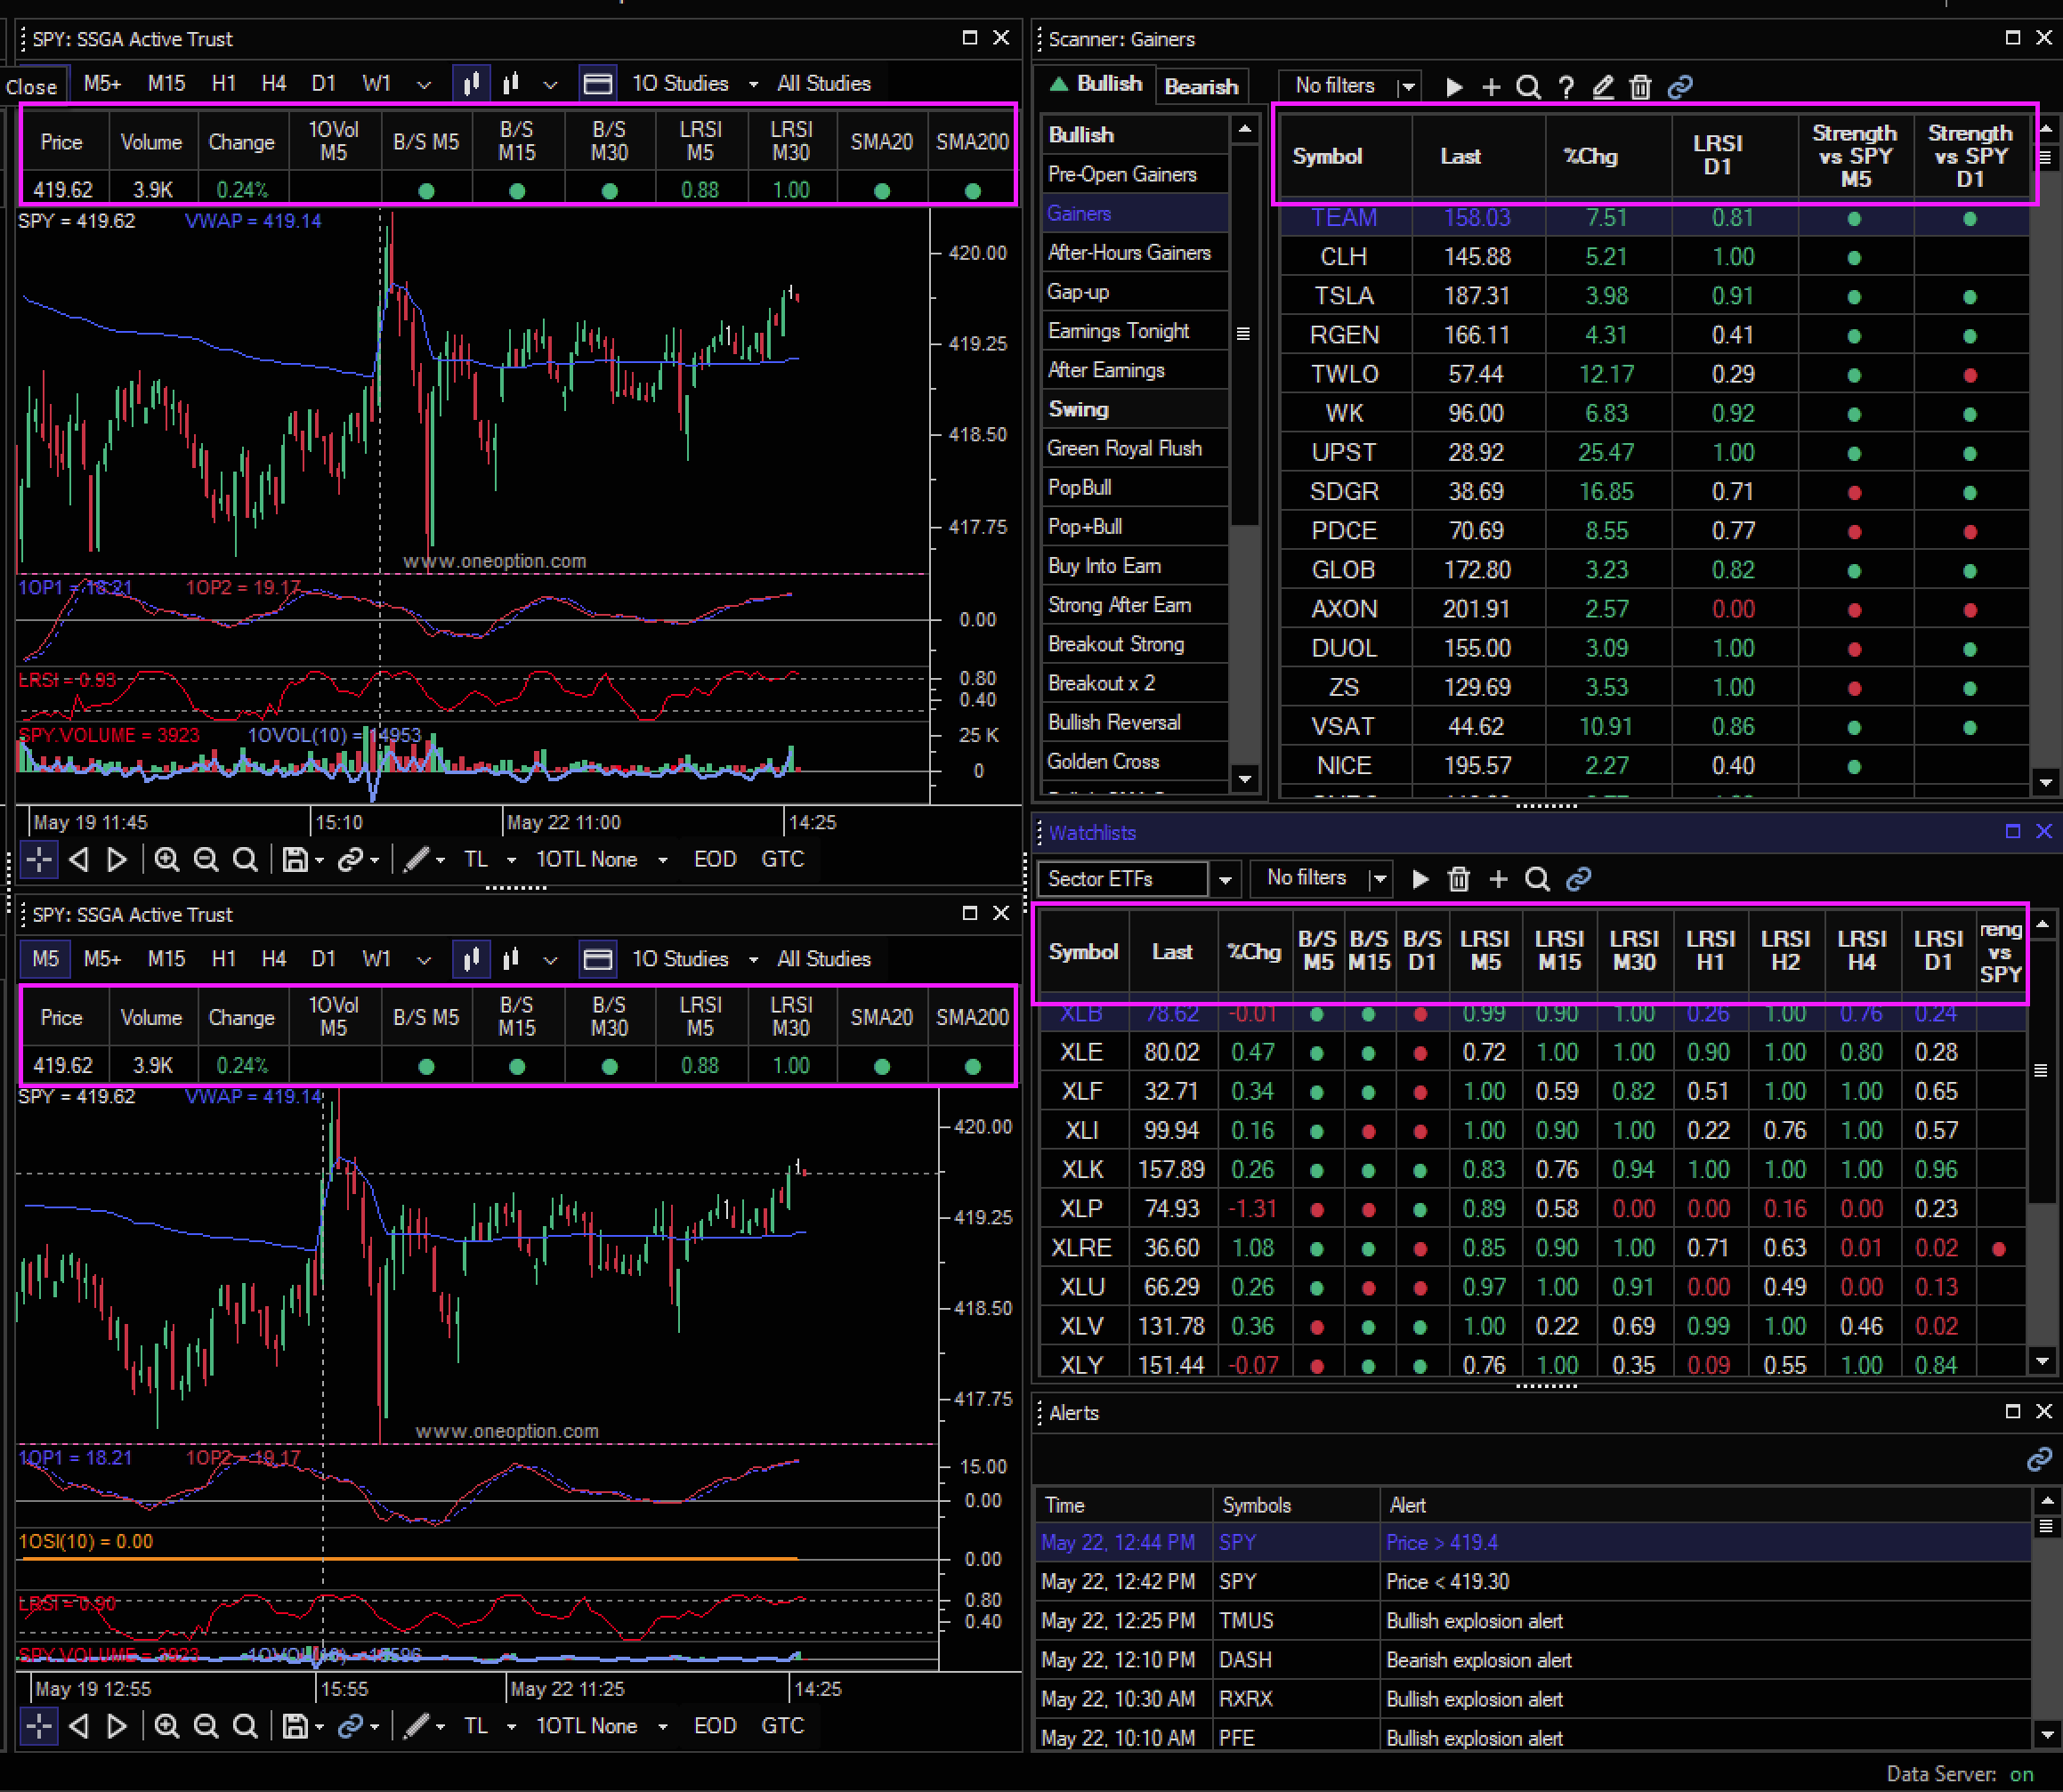
Customized columns are shown in the Chart HUDs, Scanner, and Watchlist. Use these columns to quickly scan lists of stocks for relevant criteria.
Quick Alert Creation
Right-Click any chart or table column to quickly create an alert. The New Alert Window will open pre-filled with the clicked symbol and variable. Right-Click the table headers to apply an alert to all symbols in a list.
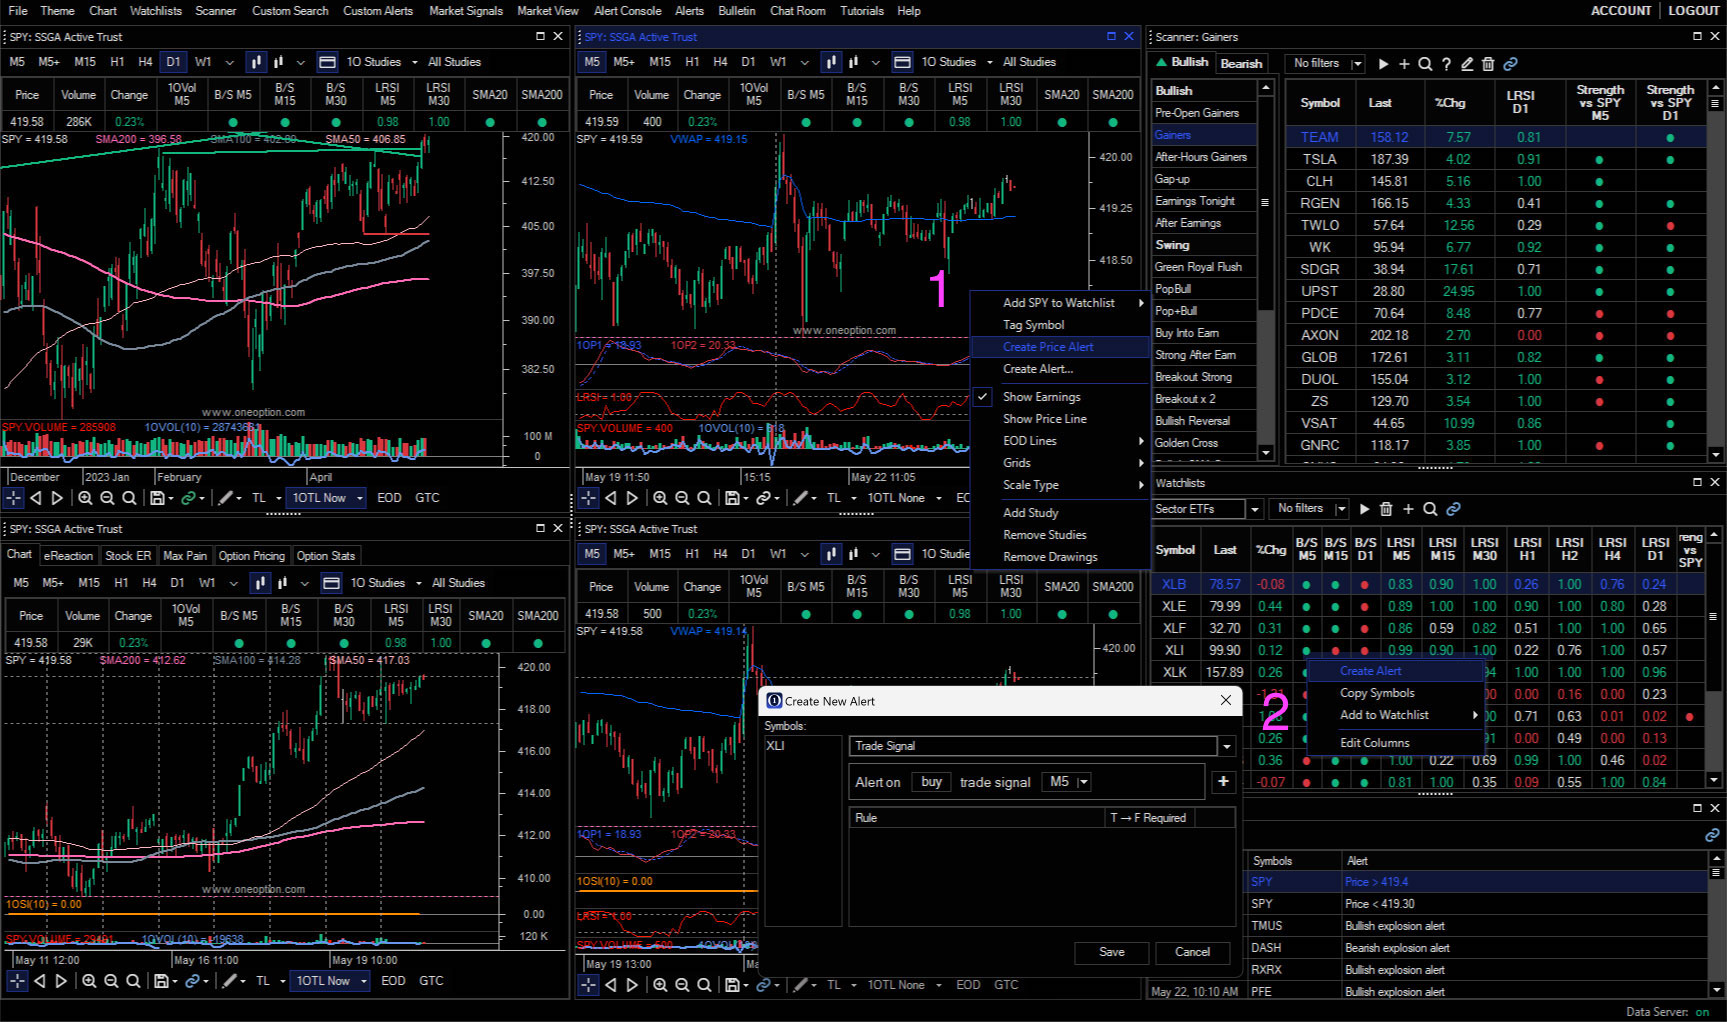
Right-Click menu showing alert creation options when (1) right-clicking a chart or (2) right-clicking a table cell.
April 2023
Option Stalker (web)
Option Stalker (web) has received the following additions and enhancements:
- Scanner Auto-Refresh Countdown Animation – A timer animation will appear to notify users of the approaching update when auto-refresh is active on preconfigured & custom scanners (saved searches).
- EMA (8) – The 8-period exponential moving average is now available on chart via chart settings.
- VWAP – Volume-weighted-average-price is now also available for intraday charts.
- Market Time option is included in Chart Settings.
- General aesthetic improvements.
Chat Room
We’ve also done quite a few things to the OneOption Chat Room that are worth reviewing:
- Audio Broadcaster – Listen to Pro traders live trading and education from within the chat room.
- Symbol Search – Search for messages containing specific symbols in Chat Search
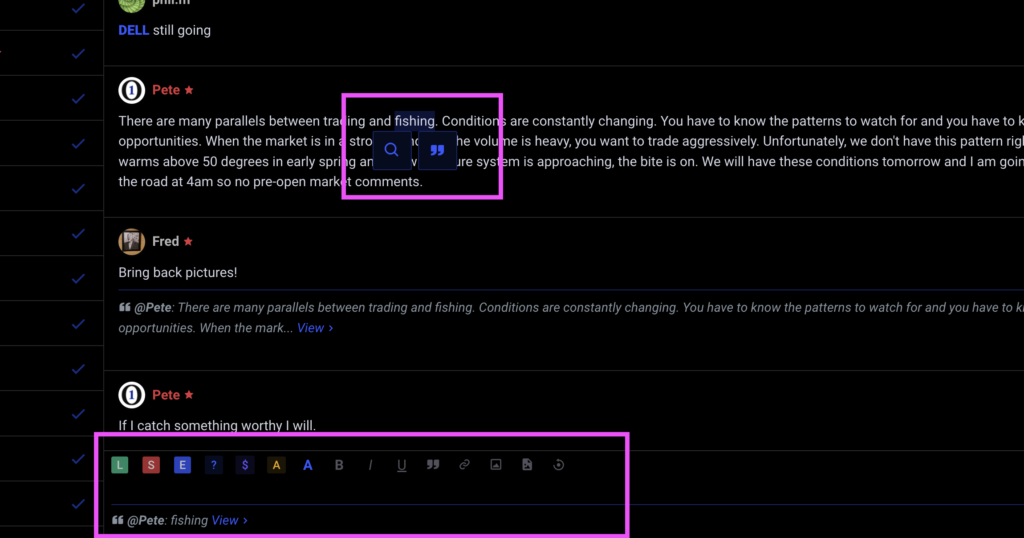
- Selection Toolbar – Select text within the chat to initiate a specific quote or search query
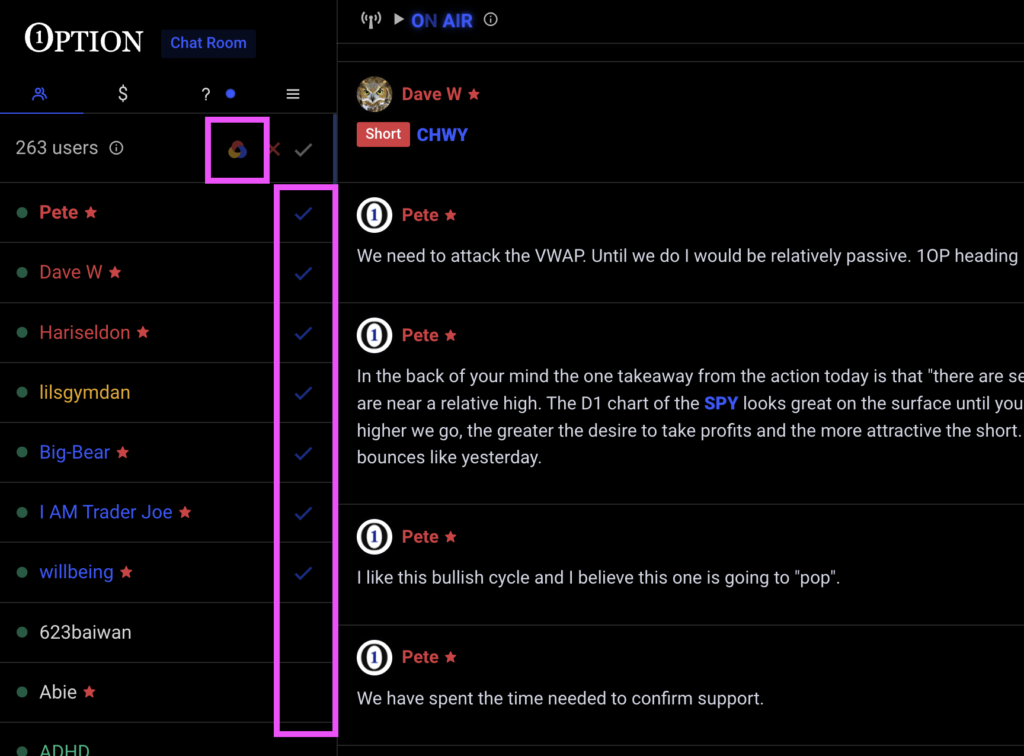
- Follow Featured Traders Button – A designated button for following featured traders (Pro, Proven and Mods)
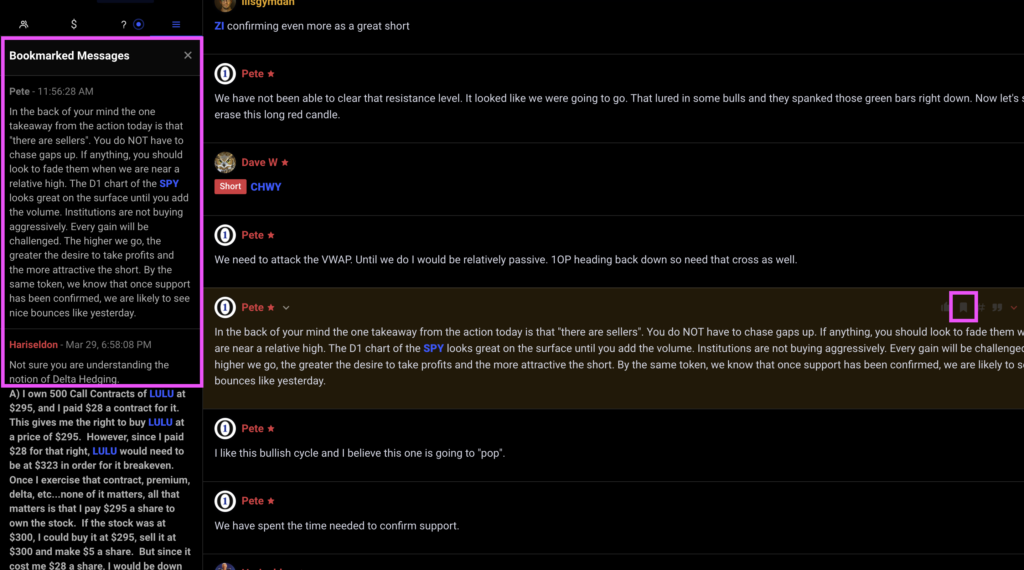
- Saved Bookmarked/Highlighted Messages – Bookmarked messages are now saved on your device for review later.
- Chat Room Policies are now require agreement on a monthly basis.
- Consolidated Trade Feedback and Questions
Visit www.oneoption.com/release-notes for a complete list of updates.
Scanner Refresh Countdown Animation
This QOL improvement shows when the next auto-refresh will occur using a simple timer countdown animation. Enable auto-refresh on preconfigured and custom scanners to see this feature.
EMA (8)
The 8-period exponential moving average is now available on for OS web charts. Click the gear icon in the Chart to open Chart Settings to add it. This indicator appears on all charts.
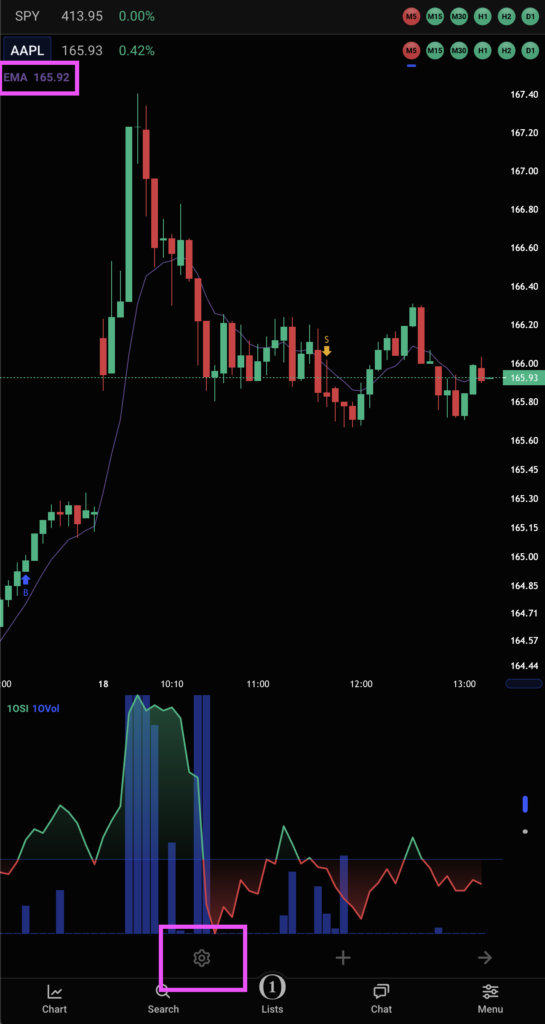
VWAP
The volume weighted average price indicator is also now available from the Chart Settings. When enabled, this indicator is visible on all intraday charts.
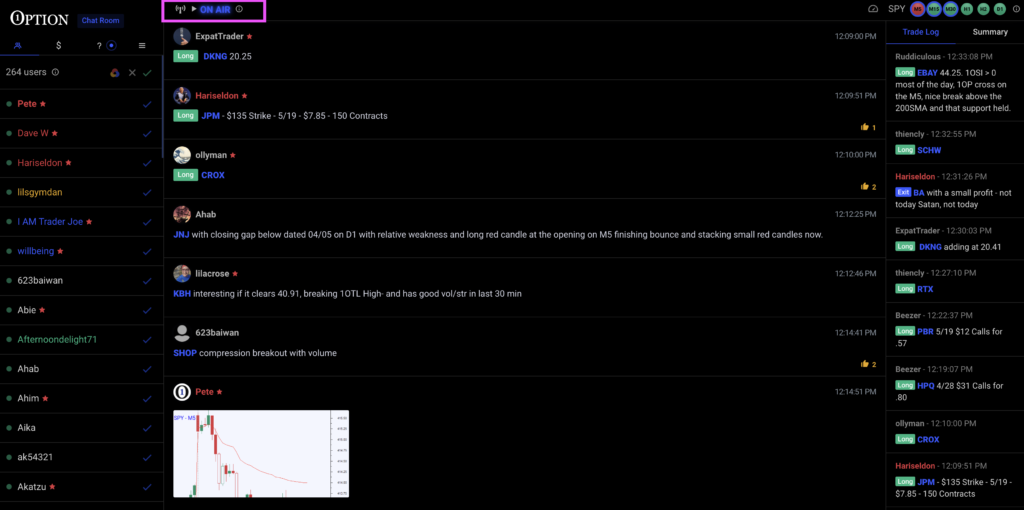
Audio Broadcaster
At the request of our esteemed Featured Trader, @Hariseldon, we added an Audio Broadcast feature to the chat room to allow Featured Traders to stream their voices to the community. The broadcast interface can be found in the upper-left of the chat room header. When live, a blue ON AIR sign will display. Click the Play button to initiate a connection and listen to the stream.
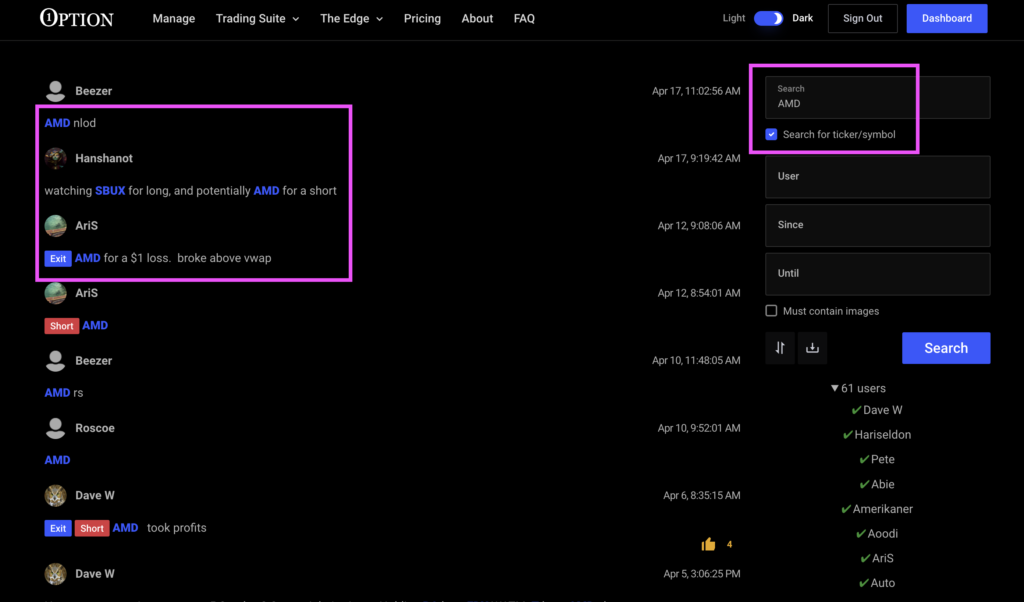
Symbol Search
The Chat Search UI is now updated to allow members to search for specific symbols within that Chat History. When Search for ticker/symbol is checked, the field will search for symbols inputted with the blue A button or $ to format the symbols.
Selection Toolbar
A small quality of life update, the Selection Toolbar appears when you highlight text in the Chat Room. Buttons allow you quickly to quote or search the highlighted text.
Follow Featured Traders Button
The user list now includes a button to allow you to follow only Featured traders (with colored usernames). When active, new members joining the chat will not be followed.
Saved Bookmarked Messages
Messages marked with a bookmark are highlighted as before and now also saved on your browser for review later. Navigate to the Chat Room menu and click Bookmarked Messages to view.
March 2023
03/06/23
This release includes a collection of small updates and fixes to OptionStalker Pro (OSP):
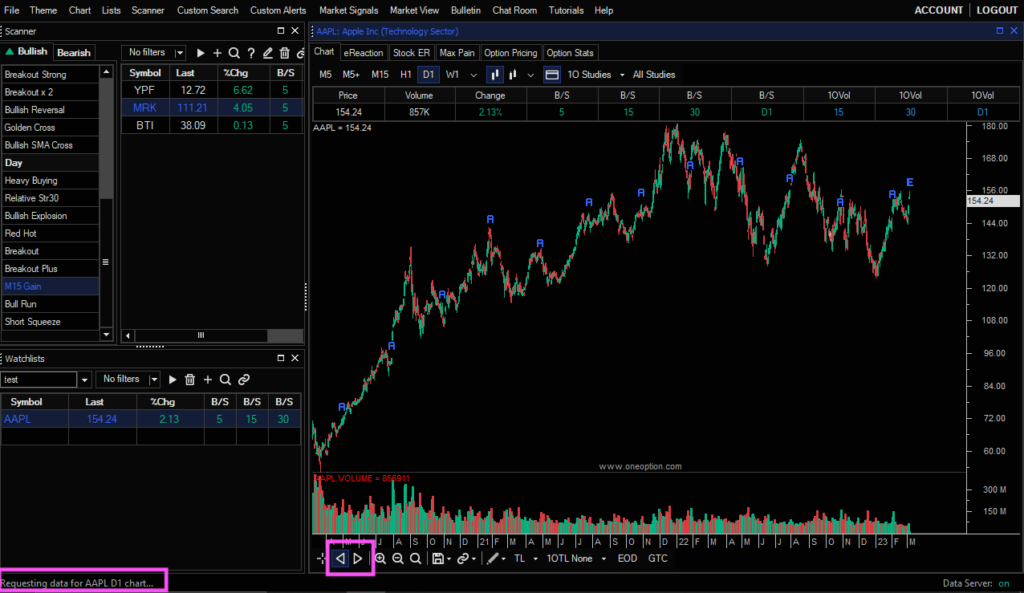
- Load Additional Chart Data – Scroll back in time with keyboard and chart arrows to load more chart historical data.
- Crosshair Keyboard Shortcut – Hold
Shiftto toggle Crosshair when hovering over chart. - Various Saved Workspace Additions & Fixes: Link groups, 1OTL, Keybar, Zoom Level, HUD visibility, Scale type.
- Added checkbox to show/hide trade orders on chart –
Right-Clickchart to adjust trade order visibility. - Zoom+ Button on charts now does opposite of Zoom- button (Zooms without blue highlight).
Shift+Clickchart area initiates user-defined Zoom interaction (with blue highlight).- Left & Right Chart Arrows are recalibrated –
Clickto advance 1 bar,Shift+Clickto advance 10 bars. - Y-axis drag disabled on charts with normalization: Semi-Log & Charts with SPY/stock overlay.
- Various API updates: Interactive Brokers, Tradier.
- Periodically checks for updates.
Visit www.oneoption.com/release-notes for a complete list of updates.
Load Additional Chart Data
You can now access more historical data using zoom and the Chart Arrows to access the start of the currently loaded data. Doing so will cause OSP to request more data for the current chart, shown in the notification message in the lower-left.
Crosshair Keyboard Shortcut
We’ve enabled holding Shift to toggle on the chart Crosshairs. This is particularly useful for users to quickly view the trendline & study prices.
February 2023
After months of hard work, we’re excited to announce the following updates to OptionStalker Pro (OSP):
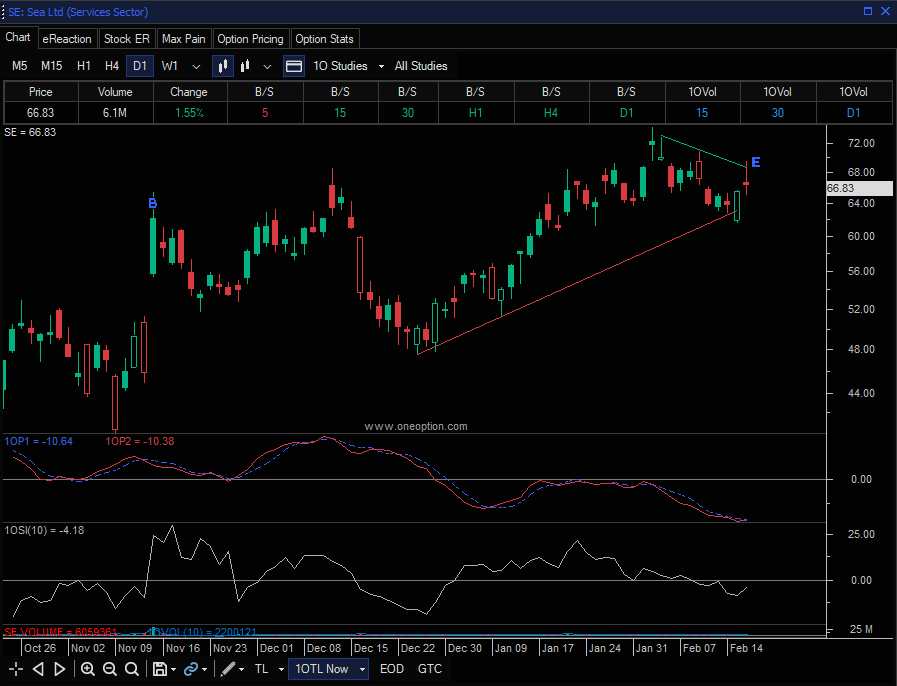
- Automated Trendlines – Auto-draw trendlines on daily charts with the 1OTL button at the bottom of charts.
- New Scanners – Enjoy new ways to find stocks with RS/RW using these new Preconfigured Scanners.
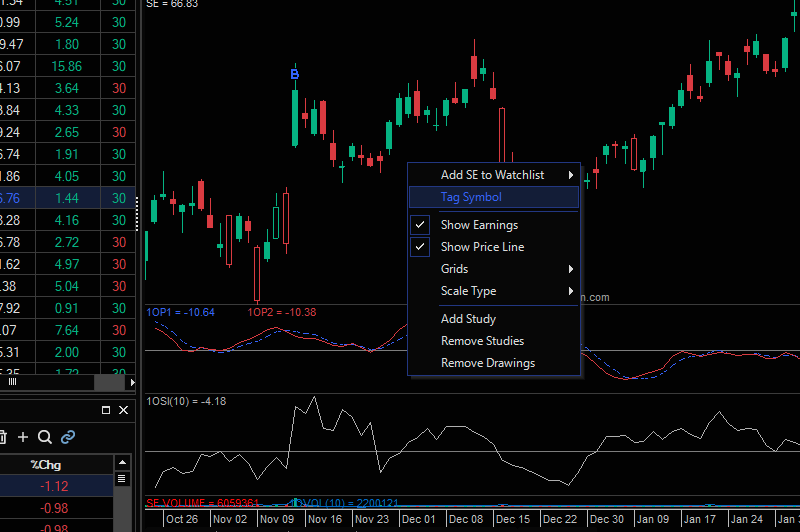
- Chart Symbol Tagging –
Right-clickthe chart area to quickly tag the selected symbol.
Other recent updates in the Chat Room include:
- Top Symbols – Track the top-mentioned symbols in the chat room across various time periods with these lists.
- Updated Quotes – Enjoy streamlined quoted messages styles for improved chat room usability.
Visit www.oneoption.com/release-notes for a complete list of updates.
Option Stalker Pro
Automated Trendlines
Pete has labored tirelessly the past few months to develop this feature. By back-engineering his decades of experience, he has created rules to auto-drawn trendlines in OSP and save traders time by vastly reducing the amount of trendlines required to manually draw. To use this feature, simply toggle between 1OTL Now and 1OTL Past at the bottom of the chart. Automated trendlines are applied to Daily Charts only. Read Pete’s article in The System, Automated Trendlines, for more information.
New Preconfigured Scanners
The Scanners panel in OSP has been given a major overhaul. Enjoy new ways to scan for stocks with new Day and Swing Preconfigured Scanners. They include scans that use moving averages such as Golden Cross and Bullish SMA Cross, breakout-focused scans such as Breakout, Breakout Strong, and Breakout x2, and more. Visit the Glossary for scanner descriptions.
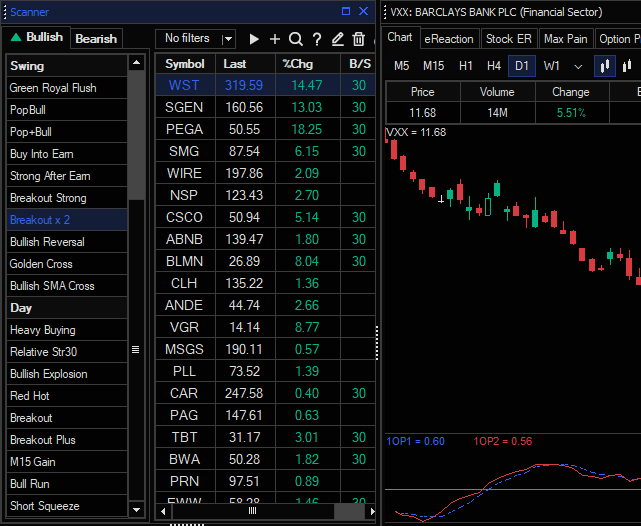
Chart Symbol Tagging
The tag list is a special watchlist that resets each day, and traders use it to track relevant stocks within the trading session. Previously, you could only tag stocks from Scanners or Watchlists using the Plus (+) icon. Now, you can also tag stocks straight from chart via Right-Click.
Chat Room
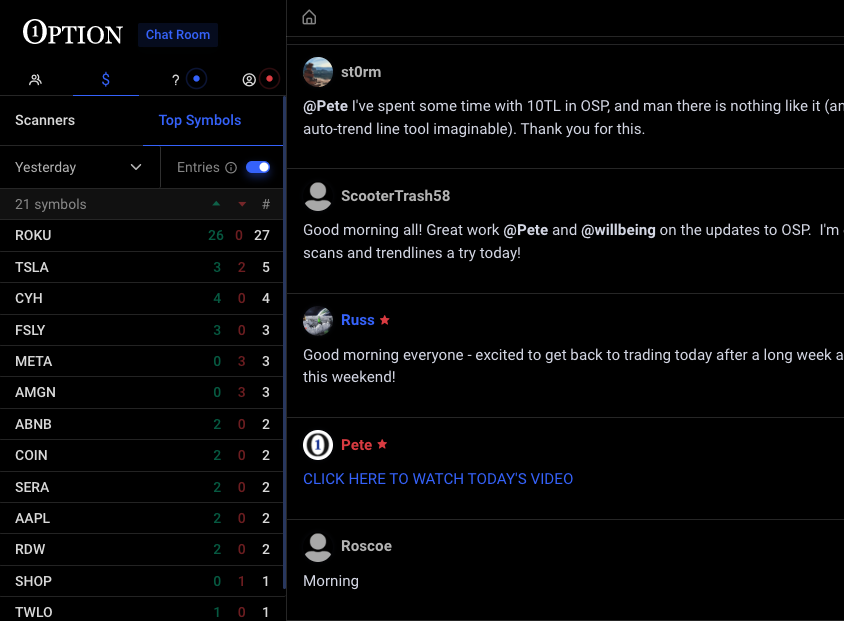
Top Symbols
The Top Symbols lists give users a new angle to analyze the chat room and incorporate its data into their trading regiment. These lists scan messages for SYMBOL links (using the style applied via the blue A button or preceded by “$”) and compiles a list of top-mentioned symbols in descending order. The results can be filtered to only include symbols accompanied by an entry badge. The counts for Long and Short entires are also included in green and red columns.
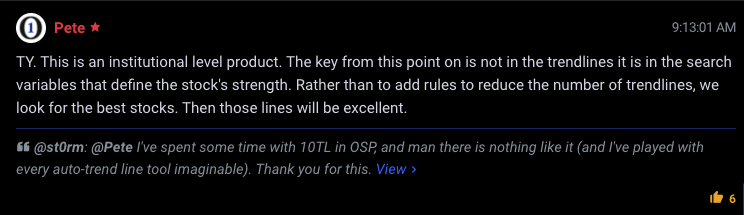
Updated Quotes
To streamline the chat room by reducing the amount of clutter and unnecessary blank space, we’ve streamlined quoted message in a couple of ways: (1) Quoted messages are reduced to text-only and only a short excerpt is included. (2) These messages are displayed in a single paragraph at the bottom of the newly composed message.
January 2023
We’ve made a few small UX changes to OptionStalker Pro (OSP) in this update:
- Single-click time frame and chart style toolbars – We reverted to the old style of chart toolbars for time frame and chart style to reduce the number of clicks.
- Favorite Toolbar Buttons – Edit which buttons are visible in the timeframe & chart style toolbars via
Right-click. - Timeframe Keyboard Shortcuts – Typing
0-9on a chart now auto-loads the change time frame input, similar to typingA-Zto change symbol. - Chart Axis Dragging – Drag the chart axis to adjust zoom or stretch/compress candles vertically
Other updates include:
- TD Ameritrade Notification Update – Broker API error notification no will no longer unnecessarily appear.
- Workspace List Linking – Scanner & Watchlist link color settings are now saved with Workspace.
- Persistent EOD Lines now save with Workspace & persist across timeframes
- Other miscellaneous cosmetic and stability changes.
Visit www.oneoption.com/release-notes for a complete list of updates.
Option Stalker Pro
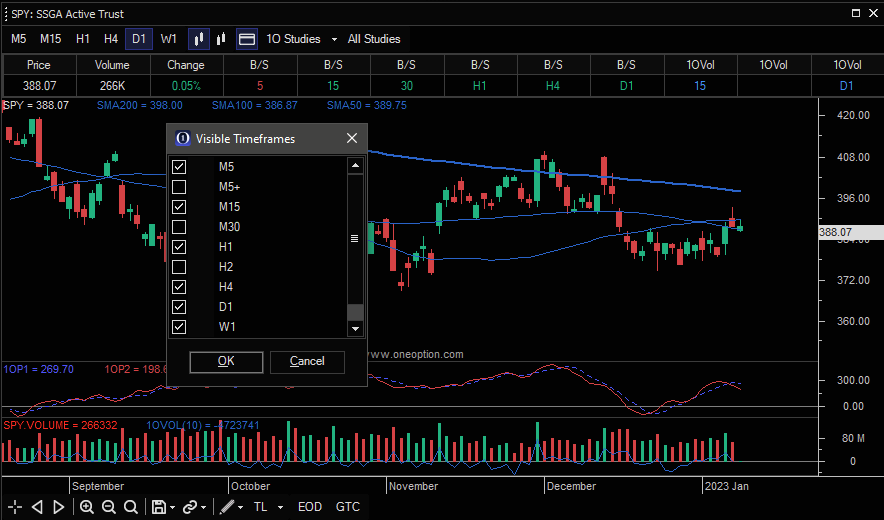
Time Frame & Chart Style Toolbars Favorites
At the top of all charts, chart styles (candlesticks, line, heikin ashi, etc) and time frames (1m, 5m, 1D, etc) are all adjustable via single-click toolbars. Candlesticks & Heikin Ashi candles are visible by default for chart styles. 5m, 15m, 1h, 4h, 1D, 1W are visible by default for chart time frame. If you right-click either toolbar, you can edit which options are visible.
Time Frame Keyboard Shortcuts
With a chart panel selected, you can now type 0-9 to bring up the Change Chart dialogue with the Interval field selected. Typing 1m and clicking OK or typing enter/return will change the chart interval to 1 min. Use the following: 5m for 5 minute chart, 1h for 1 hour chart, 1D for daily chart, 1W for weekly chart, and 1MN for monthly chart.
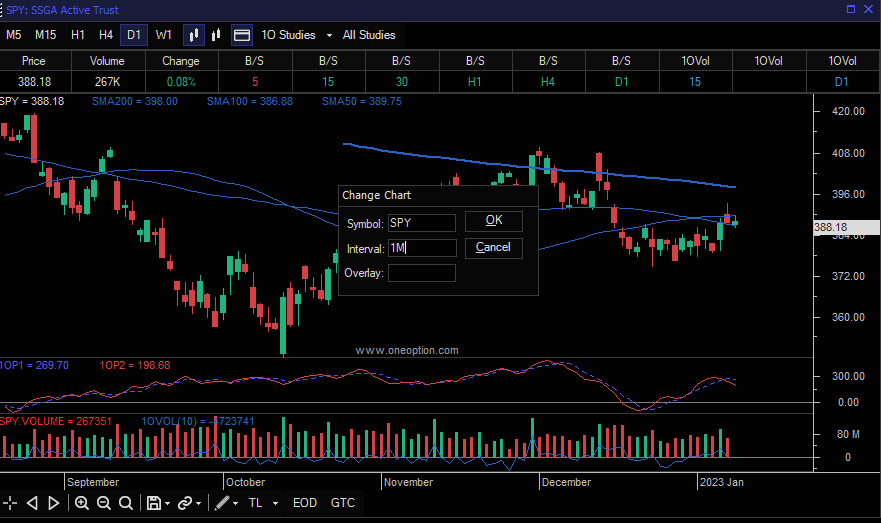
Chart Axis Dragging
Drag the x-axis at the bottom of a chart to adjust zoom. Drag the y-axis on the right side of a chart to stretch or compress the chart vertically. Double-click an axis to reset it to auto.
December 2022
Welcome to the December 2022 OneOption update. We focused on OptionStalker Pro (OSP). Some of the key highlights include:
- Workspace Save/Load – You can now save & load your workspace!
- Intraday Price Lines – Daily SMAs and previous day high/low are now visible on intraday charts
- New Indicator – Laguerre RSI
- New Indicator – Keybar
- Volume Bug Fix – Volume bar issues have been resolved.
- Persistent Trendlines – Chart trendlines will now save and reappear.
- Earnings Icon Visibility Toggle – Show/hide earnings icons
- Zoom Standardization – Chart zoom level is retained when symbol or timeframe is changed.
- Add Symbol To Watchlist Shortcut – Right-click chart or list to add symbols to watchlists
Other updates include:
- Filter Options Included in Workspace – Watchlist/Scanner filter settings are saved with workspace.
- Indicator Colors Saved With Workspace – Custom colors applied to indicators are saved with workspace.
- Chart Refresh Shortcut – When a chart is selected, type
Ctrl+rto refresh chart - Multi-screen Workspace Support
- Study Crash Fixes
- Miscellaneous Cosmetic Updates – Platform styles continue to be updated for brand uniformity
Visit www.oneoption.com/release-notes for a complete list of updates.
Option Stalker Pro
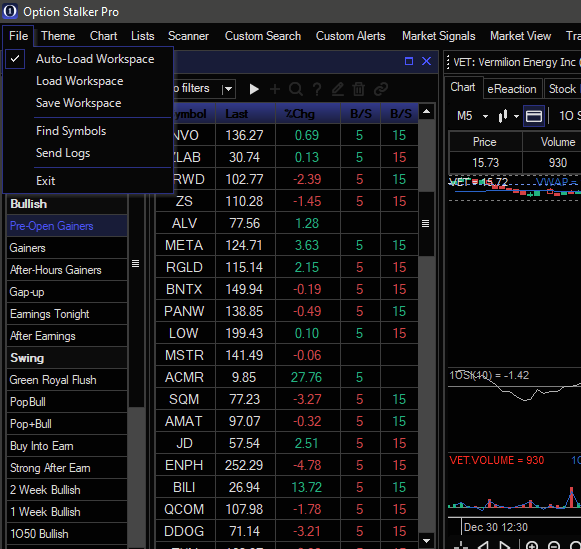
Workspace Save/Load
From the File menu, you can now ‘Save Workspace’ to save the charts, indicators and other settings currently present in your workspace layout. When ‘Auto-Load Workspace’ is checked, the most recently saved workspace will load at startup.
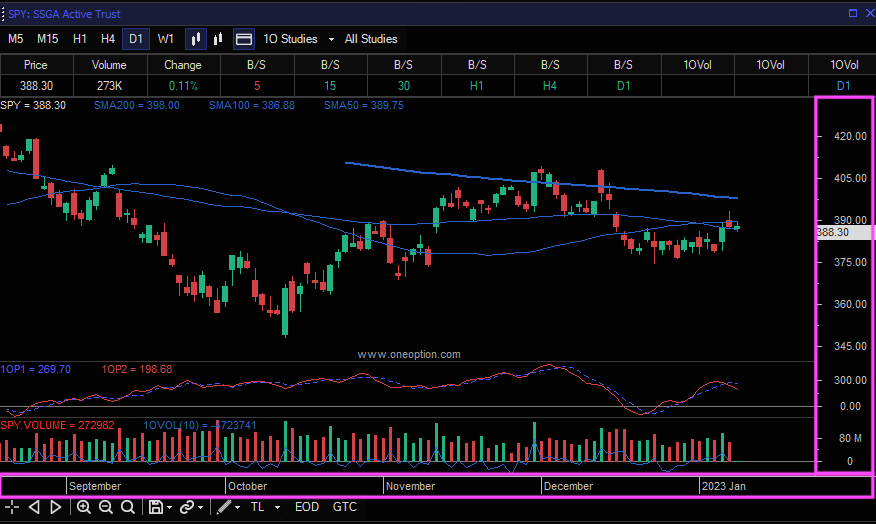
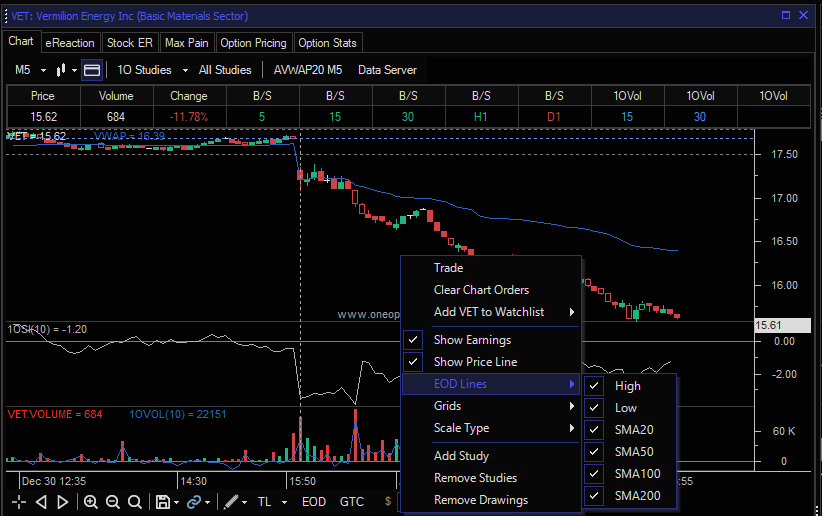
Intraday Price Lines
You can now display price levels for Previous Day High, Previous Day Low, and Daily SMA 20, 50, 100, and 200 on intraday charts. Simply Right-click the chart to apply.
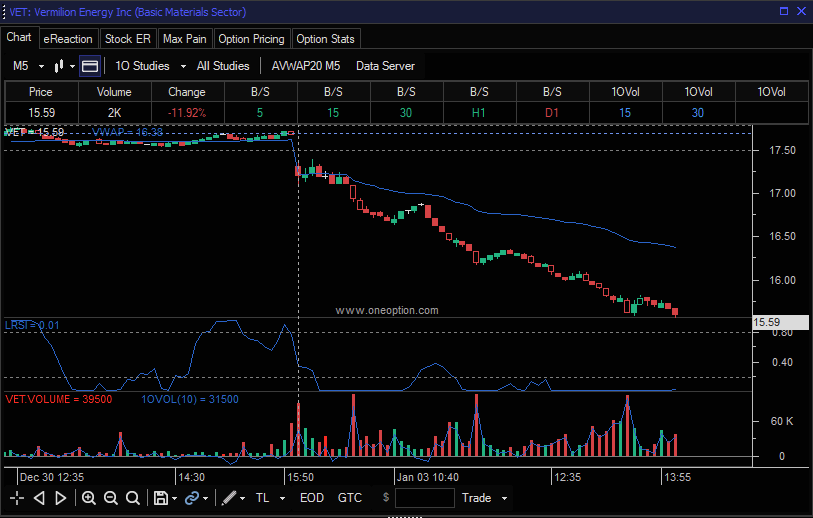
New Study: Laguerre RSI (LRSI)
Apply the LRSI via ‘All Studies’ on a chart. Learn more about this indicator with this video.
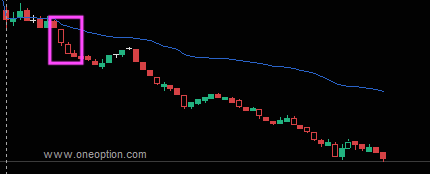
New Study: Keybar
Apply Keybar via ‘1O Studies’ on a chart. A key bar has a greater than average ATR, a large body relative to the intraday range and better than average volume. Typically these bars resulted from a trend day that saw persistent buying/selling. They tend to continue in the direction, particularly if that candle coincides with a breakout above a trendline or a major moving average. When these candles reverse, it happens very quickly. If the open from that candle is reversed, the follow through in the opposite direction will last for at least a few days. When these candles appear at the extreme of a range, use extra caution and confirm the directional strength. Key bars are displayed as candlesticks without fill.
Volume Bug Fix
User reported issues with volume bars becoming either unresponsive or inaccurate. Volume bars now reliably display correct volume across all APIs. Thank you for your feedback!
Persistent Trendlines
Trendlines now are saved on a chart. If you draw a trendline on ABC, change chart symbol to view stock XYZ, then return to view chart for ABC, the trendline you drew will remain. We hope to apply this across different timeframes in the future. Stay tuned!
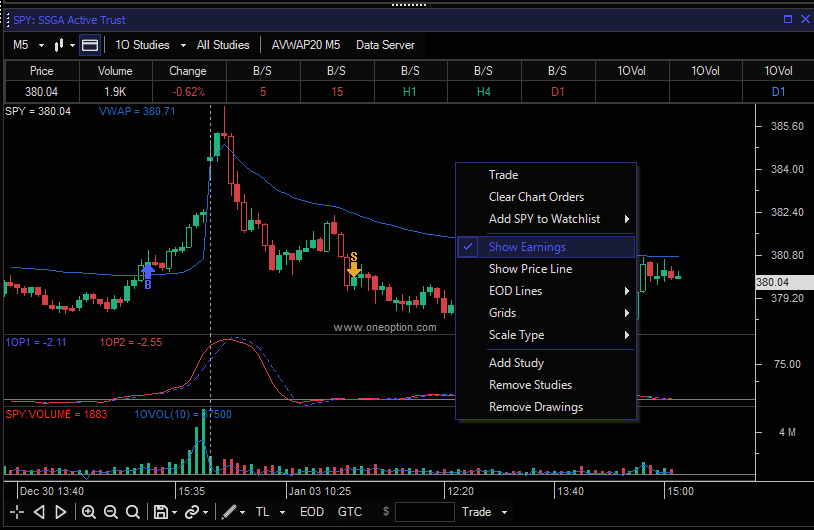
Earnings Icons Visibility Toggle
Not only did we redesign the earnings icons (let us know if you prefer them larger!), but we also added the option to show/hide these icons on a chart. Simply Right-click chart to toggle earnings icon visibility.
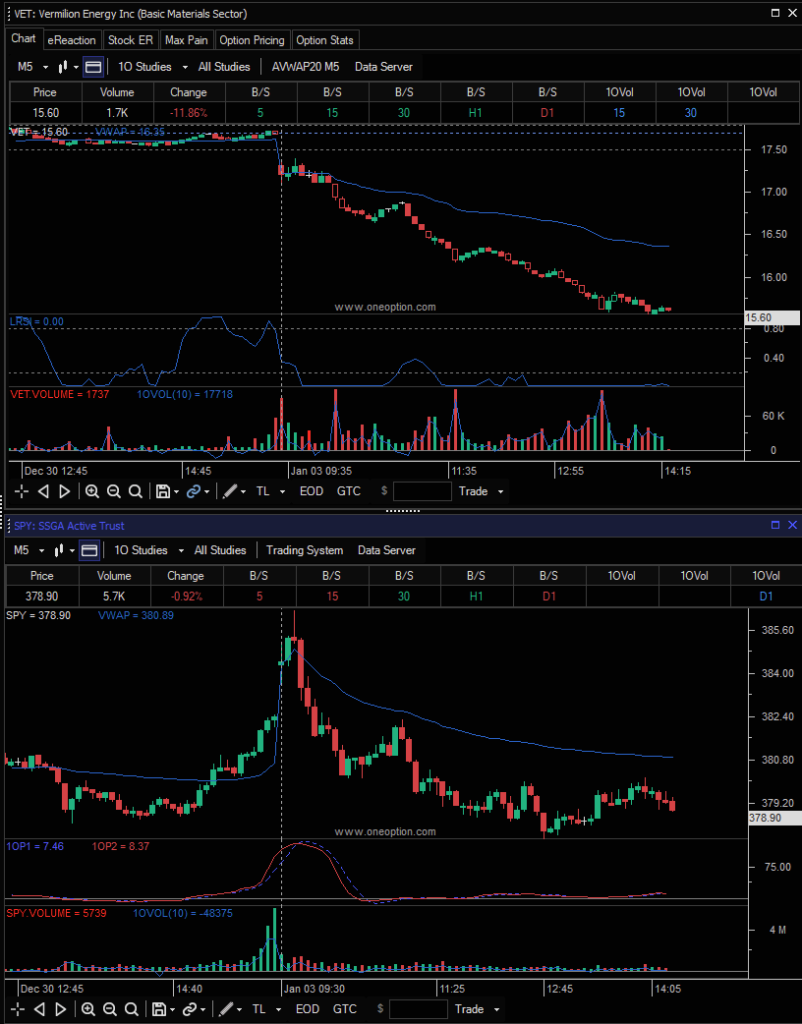
Zoom Standardization
Some users reported chart zoom adjusting slightly when a chart symbol is changed. We made some changes to prevent this behavior. Now, chart zoom is fixed unchanged when switching symbols. This ensures that charts are aligned when stacked vertically, such as for comparison to SPY.
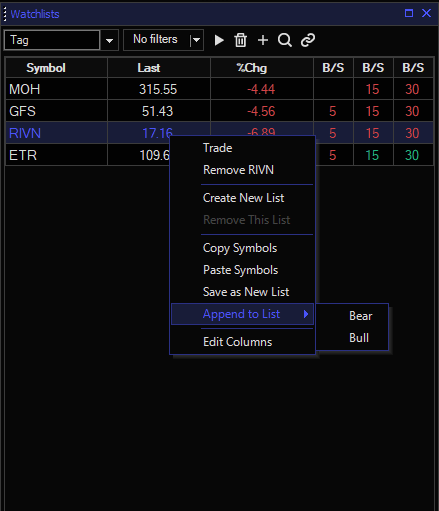
Add Symbol To Watchlist Shortcut
There’s a new way to quickly add symbols to watchlist: Right-click charts and lists to bring up the dialogue and click ‘Add XXX to Watchlist…’ or ‘Append to List’.