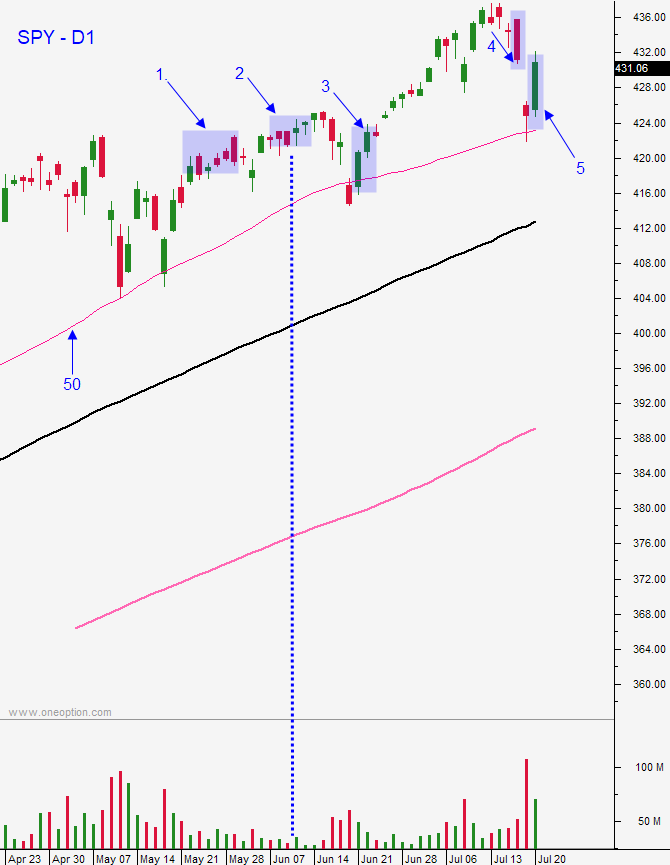
How does the current day fit into the longer term picture? Answer this question and you will know the context of the current move. In the screen shot below I numbered 5 time frames and I will describe the context for each period.
- If I were day trading futures in this time frame the first thing I would notice is that we are trading in a longer term up trend and that we are near the all-time high. That means that I can expect resistance and selling pressure. The red candles are created because the market opens near the high of the day and then it gradually drifts lower during the day. If I am day trading futures I need to be aware of this pattern. I will be watching for signs of strain and I will favor the short side when I get an opening gap higher.
- During this time frame a few things stick out. First of all, we are poking through resistance at the all-time high on extremely light volume. You can see that the bodies of the candles are tiny (dojis). That means that the ranges are tight and that the closing price is likely to be very close to the opening price. These choppy little days are filled with noise and it is best not to trade futures in this environment. If I were going to trade these moves I would look for large moves away from the opening price and I would try to scalp futures as they return to that price
- During this time frame I can see that the previous day the SPY closed below the 50-day MA. The previous times (many of which you can’t see on this chart) have resulted in snap back rallies. Once we are back above the 50-day MA the buying pressure is steady and the move typically lasts all day with the market closing on its high of the day.
- In this period I can see that the previous day the market had a decent range. The tails are fairly long and the market closed right where it opened. That doji signals a potential trend reversal. The market gapped higher the next day and it resulted in a gap reversal. We know that because there is a long bearish engulfing candle. Off of a new all-time high this bearish engulfing candle will frequently result in follow through selling the next day. That means that I should favor the short side the next day.
- The previous day the market tested the 50-day MA. We know that buyers have scooped stocks when that has happened previously. At the start of the day I will be looking for strength and a bullish trend day is likely.
Before you attempt to day trade the S&P 500 you need to put the current day into context. Look at previous price movement and try to visualize how the day might unfold. Try to define the various scenarios that might play out and determine how you will react to each. We never try to guess what the market is going to do. We evaluate price movement and then we react.