Today’s market commentary will depart from my normal short-term analysis. The macro picture has changed and the market is transitioning. Since 75% of all stocks follow the market, this is the starting point for my analysis.
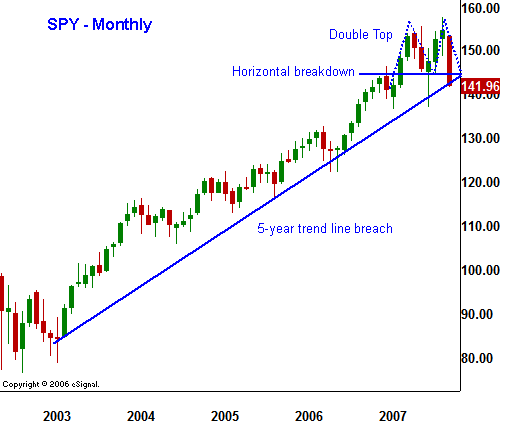
I start each week with a long-term perspective. Quite honestly, it doesn’t change that often and I don’t have to spend much time on it. There are times when a short-term move might seem very legitimate and significant, like the decline we witnessed in March. A long-term chart will remind me that a bullish five-year trend should carry the most weight. In that spirit, the decline represented a buying opportunity once support was identified.
Using that same school of thought, the August decline was also a buying opportunity. In both cases, the market regained its footing and short covering fueled prices to new highs. As the end of October approached, bullish seasonality and a rate cut by the Fed almost pushed the market to new highs. Personally, I was drawn in by the rally and I was slow to give up my bullish bias because of the long-term trend. That mentality failed me in the short-term and I had a nasty drawdown. Over the long-haul, that mindset has served me well. In the chart below you can see the price action for the last five years. A double top formation is clearly identified and the five-year trend line has been breached. When technical formations show up on a five year chart, they need to be respected.
.
.
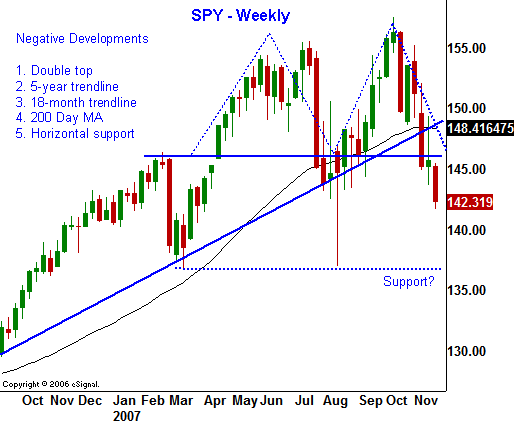
This decline is much different than the two we saw earlier this year. Strong selling set in before the market could challenge the all-time high. As the move unfolded, we witnessed persistent selling into every rally. The decline has been steady, unlike the quick head-fakes we saw earlier in the year. The technical picture continues to deteriorate and now the market has broken an 18-month trend line, the 200-day moving average, and a major horizontal support level. All of this has happened during a seasonally bullish period. In the chart below you will see the technical damage that I referenced.
.
.
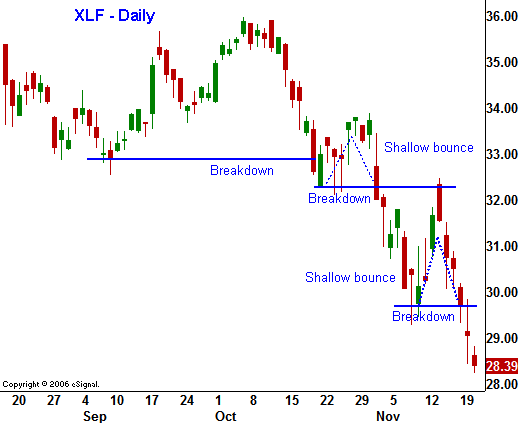
This next statement is not a revelation for anyone. The financial stocks are the root cause of the market decline. They comprise 20% of the S&P 500 and it is the largest sector in the US stock market. The problem is that the extent of the damage is not known. Financial firms are taking huge write-downs and they are trying to “come clean” by identifying losses.
Many of the assets they have on their books are ill liquid and they cannot be accurately priced. Consequently, the asset values are estimated. No one knows how far this credit crunch might spread and investors are nervous. Loans that currently seem secure could be jeopardized by an economic slowdown. If the unemployment rate creeps higher, the “housing bubble” could just be getting started. Most housing slumps last 18- 54 months and we are in the 24th month according to many experts. This housing boom was bigger than any other and that may mean that the bust will also exceed the norm. To make matters worse, many homeowners opted for low adjustable-rate mortgages and they bought more home than they could afford three years ago. Now, those mortgages will adjust to higher interest rates in the next few months. The number of foreclosures is sure to rise.
In the chart below I have shown you the XLF. I feel it is the most important index to monitor at this time. Without help from financial stocks, this market does not have a chance of staging a meaningful rally. As you can see, the selling has been persistent and the bounces have been short and shallow. Each ensuing decline makes a new relative low and that is a very bearish pattern. Given the magnitude of the problem and be uncertainty, this condition will take many months, possibly years to resolve.
.
.
This week, Freddie Mac and Fannie Mae both announced horrible results. They are the two largest guarantors of home mortgages in the nation. They are “backed” by the government and it looks like that safety net will be tested. Yesterday, Freddie Mac announced that they will need to raise additional capital just to meet minimum regulatory requirements. In this environment, the cost of new capital is rising quickly.
I have not discussed the fundamental issues outside of housing that are weighing on the market. I will do that next week. The take away is that the market has changed technically. I believe that is premature to turn out right bearish. However, I believe that a clearly defined resistance level lies at the all-time high and I do not believe that it will be broken anytime soon. The market is likely to establish a low in the next month or two and trading will be volatile within that range. From a trader’s perspective, there will be many opportunities on both sides of the market.
If you started trading in the last five years, you have been able to get away with a one-sided approach. Most novice traders only like to buy stocks and after a 5-year rally, there are many people who think they can do this professionally because they have been successful. If this sounds familiar, here is a word of advice – LEARN HOW TO SHORT STOCKS! Many novice traders will get washed out in the next year because they fail to adapt to changing market conditions and because they won’t take losses. Don’t be one of them. The Daily Report offers you great long and short opportunities.