Mastering chart patterns is essential for making informed decisions and maximizing profits. This article aims to provide traders with a broad understanding of price action and shed light on a particularly crucial one – the “double top pattern.” Beyond their technical aspects, they offer a glimpse into the collective psychology of market participants. Traders who comprehend the underlying dynamics reflected in these patterns can navigate markets with a nuanced perspective and potentially gain an edge while trading.
Table of Contents
Understanding Chart Patterns
What Are They?
Chart patterns are visual representations of price movements in the financial markets. These visual cues, formed by the interplay of supply and demand, serve as roadmaps for traders. Price patterns encompass a wide array of formations, from the simplicity of triangles to the complexity of head and shoulders, each telling a unique story about market sentiment. Importantly, recognizing price patterns is not only about identifying shapes on a chart; it’s about interpreting individual candles and the underlying market dynamics that these patterns signify. Traders who delve into the narrative behind each pattern elevate their analysis beyond mere technicality to gain a holistic understanding of market behavior. This is a fundamental skill that all traders must master.
Importance of Recognizing Patterns
Successful traders leverage chart patterns not as foolproof predictions but as a tool in their toolbox for formulating effective strategies. By understanding these patterns, traders gain valuable insights into the psychology of the market, enabling them to make more informed decisions in the face of uncertainty. Trading takes time and this in particular requires hours of chart reading. We recommend visiting our Daily Market Analysis and Annotated Charts to refine your skills. Additionally, these patterns can act as leading indicators, providing early signals of potential trend reversals or continuations. Traders who incorporate these signals into their decision-making process can stay ahead of the curve, adjusting their strategies proactively in response to changing market conditions.
Interested In Learning More?
Exploring the Double Top Pattern
What is a Double Top?
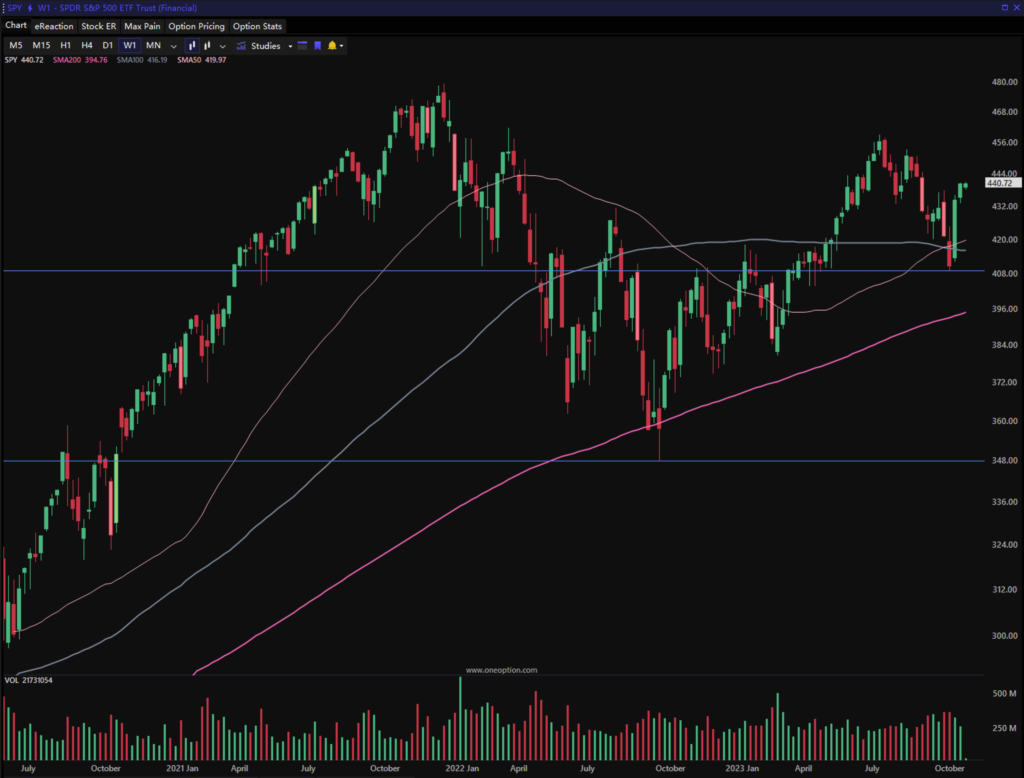
Among the many chart patterns, the “double top pattern” stands out as a powerful indicator of a potential trend reversal. This pattern is characterized by two peaks at approximately the same price level, separated by a temporary trough. It signifies a shift from a bullish to a bearish trend, offering traders a unique opportunity to capitalize on changing market dynamics. Understanding the behavioral nuances embedded in this pattern empowers traders to anticipate not just price movements but also the motivations driving those movements.
Identifying the Double Tops
Traders keen on mastering price patterns pay close attention to the identification and confirmation of the double top pattern. Spotting the formation involves a vigilant analysis of price movements and an understanding of the psychology behind the market participants. Additionally, employing technical indicators and oscillators can further enhance the precision of identifying this pattern, providing traders with a more comprehensive approach. Furthermore, recognizing the duration between the two peaks and the depth of the intervening trough, can add an extra layer of sophistication to a trader’s analysis.

Strategies for Trading Double Tops
Confirmation Signals
To enhance the effectiveness of trading based on the double top pattern, traders often seek confirmation signals. These signals can include a break below the trough’s support level, increased selling volume, or additional technical indicators aligning with the reversal. The careful consideration of multiple signals adds layers of confirmation, bolstering the trader’s confidence in their decision-making process. Traders can explore the concept of divergence, where the price makes a new high, but a corresponding technical indicator, such as the Laguerre Relative Strength Index (LRSI), fails to confirm it. Recognizing divergence can provide additional confirmation of the weakening bullish momentum associated with a double top pattern.

Risk Management
Like any trading strategy, utilizing the double top pattern requires a robust risk management plan. Traders should set clear stop-loss levels and position sizes to mitigate potential losses. Additionally, diversifying the overall portfolio and avoiding over reliance on a single pattern can contribute to a more balanced and resilient trading strategy. Risk management extends beyond individual trades; it involves understanding the broader market context. Traders who integrate macroeconomic factors and geopolitical events into their risk management strategy can better navigate the uncertainties that may impact the effectiveness of the double top pattern.
Interested In Learning More?
Integrating Chart Patterns into Your Trading Strategy
Harmonizing Patterns with Technical Analysis
Successful trading involves combining price patterns with other technical analysis tools. This synergy provides a more comprehensive view of market conditions, helping traders make well-rounded decisions. By integrating price action with moving averages, trendlines, and Fibonacci retracement levels, traders can develop a holistic approach that considers both historical price movements and current market dynamics. Furthermore, understanding the interplay between different patterns can provide a deeper layer of insight. For instance, recognizing how a double top pattern aligns with a broader ascending triangle formation can offer a more nuanced perspective on potential breakout scenarios.
Real-World Examples
As mentioned before, it is best to explore real-world examples where the understanding of chart patterns, especially the double top, could have been a game-changer for traders. Learning from historical cases can illuminate the practical application of these patterns in live markets. We recommend reviewing our Daily Market Analysis and Annotated Charts for this purpose. Examining case studies where the double top accurately predicted market reversals can provide valuable insights and reinforce the importance of incorporating these patterns into a trader’s analytical toolkit. Additionally, considering scenarios where the double top pattern might have provided false signals can offer lessons in risk management and the importance of validating pattern signals with a holistic market analysis.

Conclusion
In conclusion, mastering chart patterns is a pivotal skill for traders navigating the complex world of financial markets. The “double top pattern,” with its distinct characteristics and reliable signals, deserves a special place in every trader’s toolkit. By assimilating these patterns into your trading strategy, you can gain a competitive edge and make more informed decisions in the ever-evolving landscape of trading. As you delve into the world of identifying patterns, remember that success lies not just in recognizing shapes on a chart but in deciphering the intricate stories they tell about market sentiment and participant behavior.


