This post was originally written for r/FluentInFinance Apr 12, 2021
You’ve done your research and you’ve found the next great trade. You can’t wait for the opening bell to enter the order and the stock looks like it wants to move higher. After a few minutes of trading the market also looks good and the stock is running so you hit the buy button. We’ve all been in this situation and here’s why you should wait for at least 30 minutes.
During early trading buyers and sellers are jousting to see who has the upper hand. Much of the price action is program driven and the price action tells us how the day is going to unfold. All of your day trades and swing trades need to start with the market. Let’s take a look at the last three days of trading and what we learned from the early action in the SPY.
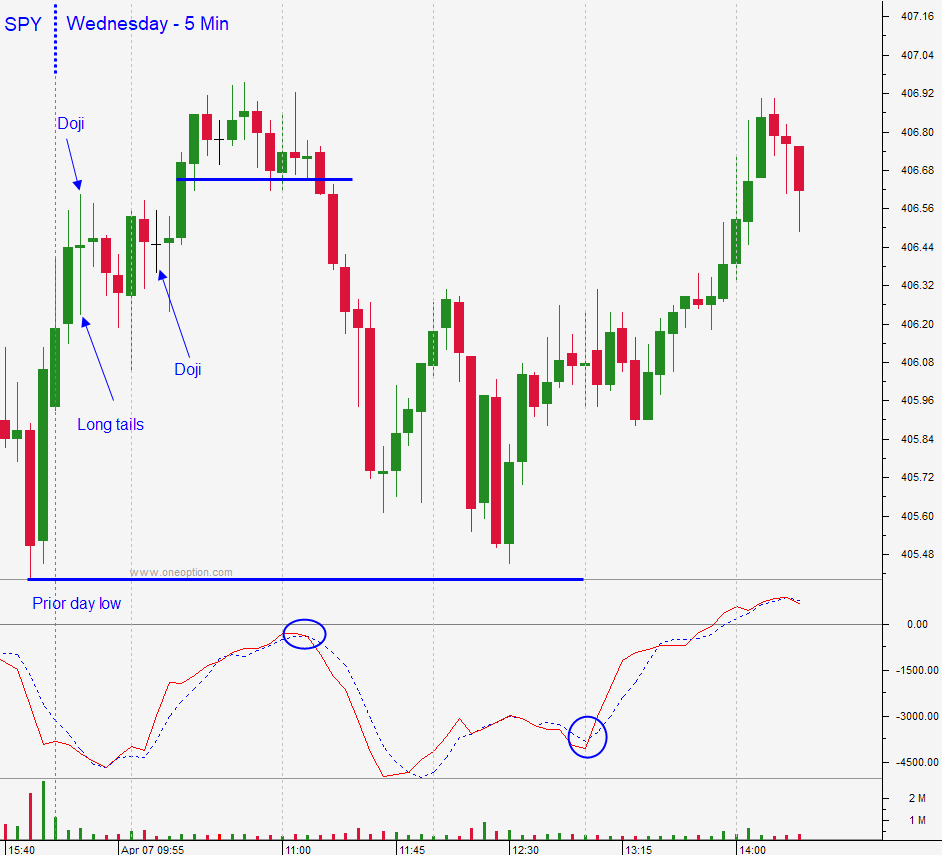
Wednesday the market opened with tiny mixed candles. That is a sign that neither side has much of an advantage. Dojis and long wicks/tails are also an indication that the price action is balanced and that neither side has an advantage. The trading volume was also very light. After an hour of trading, you would conclude that if you were day trading you should expect a tight range and that you should trim your size and set passive targets.
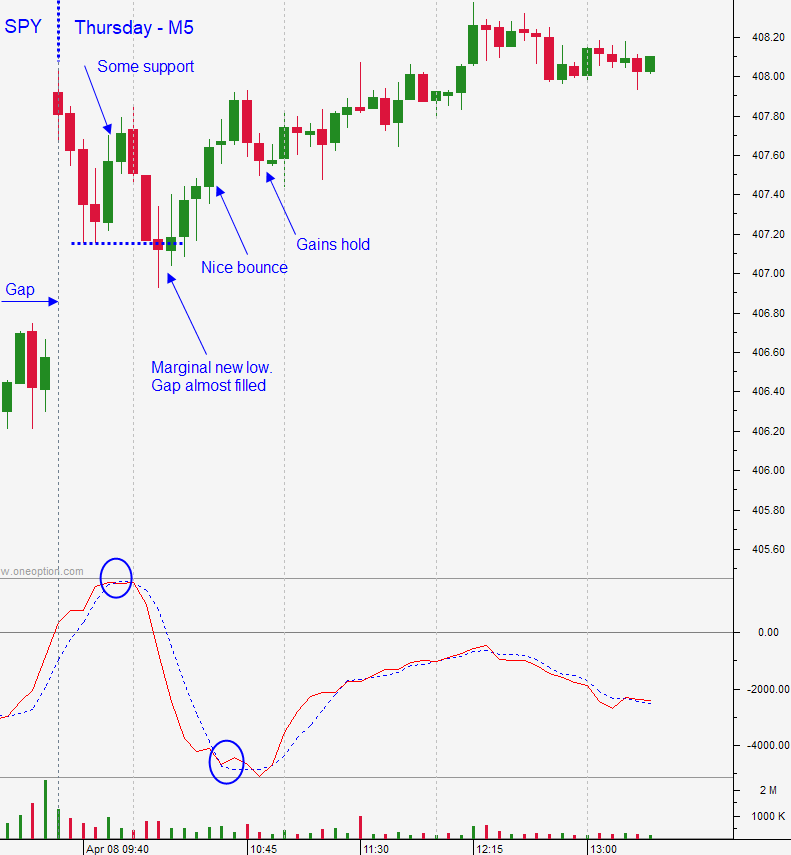
Thursday the market gapped higher. Gaps to new relative highs have been faded and you should expect the bid to be tested. You need to be careful of a gap reversal and you can see from the green candles in the first 30 minutes that there is some buying. That tells me that a big drop and a gap reversal are unlikely. If there were going to be a gap reversal those green candles would not have been as big and they would not have come so soon. On the next drop, we can see that the market almost filled the gap and that the new low of the day was barely below the prior low (marginal new low). The next series of green candles confirms that buyers are still engaged, and that provides you with a better entry point. If you bought the open you overpaid for your position and you were exposed to a possible gap reversal. If you were day trading you might have been stopped out for a loss.
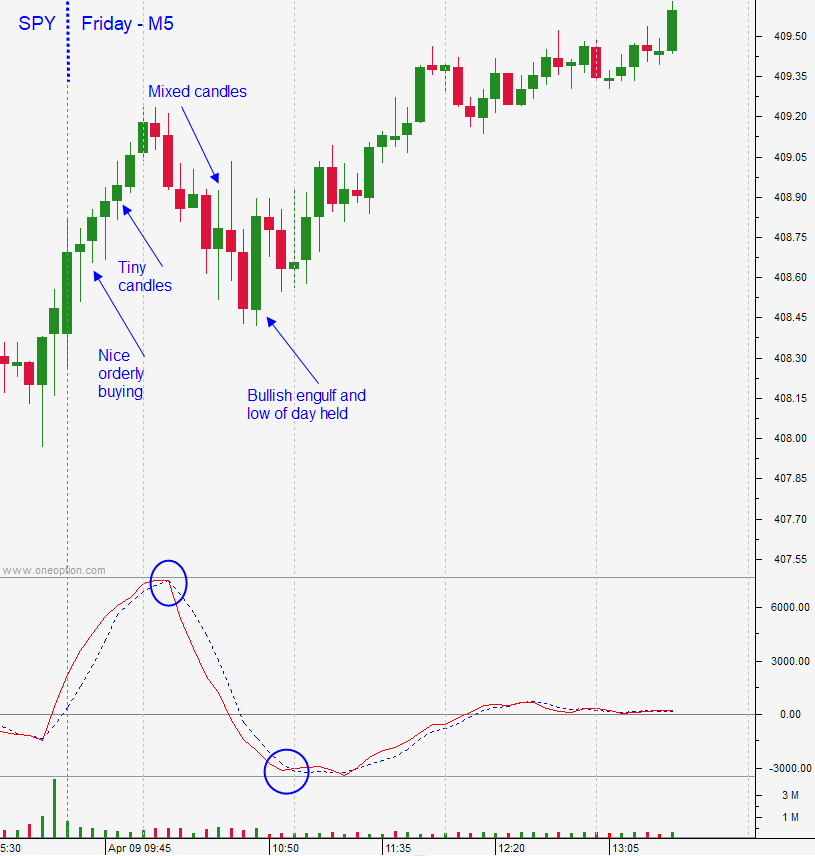
Friday the market started off with a series of nice green candles. That move was orderly, but the candles were tiny and that is a sign of resistance. That move lured in bullish speculators and the market was making a new high. After that initial push higher, the market tested the low of the day. If you bought too early you overpaid. The market dip had tiny candles indicating that the retracement was also weak. On the low of the day, you can see a long green candle (bullish engulf). That is a sign that support is strong at the low of the day.
The information that we get in the first 30-45 minutes helps us gauge the market. It tells us how aggressive buyers and sellers are trading. During that early action, we can also gauge how the stocks we want to buy are behaving. If the market is going down and the stock is going up, I know the bid is strong and that the stock is ready to fly. If I buy the stock right on the open I do not have that information.
Let’s use an example from last Friday. CRM looked great. The stock had formed a base on a daily chart, the stock had heavy volume and we can see on a daily chart that it was testing the 100-day and the 200-day MAs. Would the stock blow through that resistance or would it pull back? The market was strong, but the tiny candles suggested that there was resistance and that we did not need to chase.
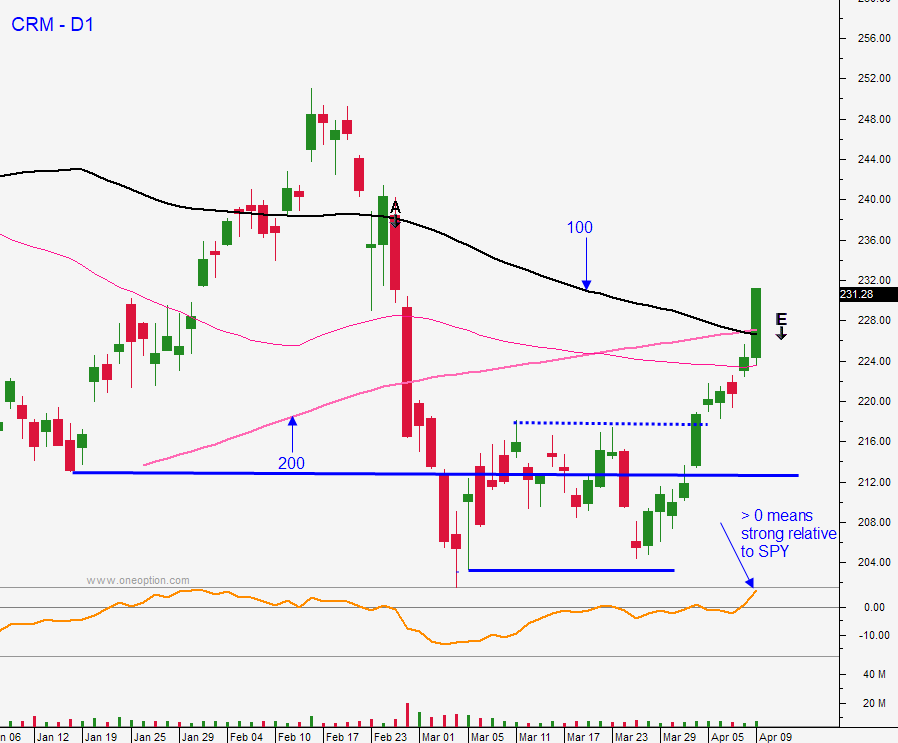
In this next chart you can see how the market pulled back and CRM stayed very close to the high of the day. This is a sign of relative strength. As soon as the market found support CRM blew through the major moving averages and you had confirmation that you had an excellent entry point. You can also see the relative strength later in the day. Relative strength is my edge and I search for it every day for my day trades and swing trades.
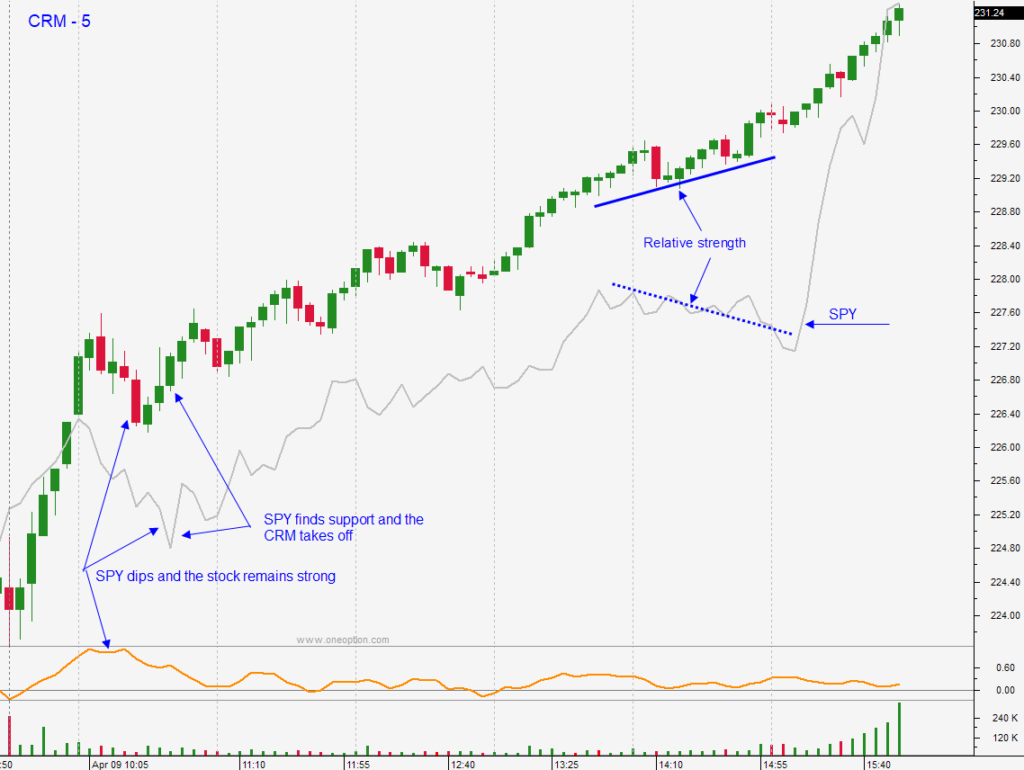
Some of you will look at the CRM chart and say, Pete you could’ve entered even better had you bought the open for CRM. In this case that is true. However, I did not know what the market was going to do or if CRM was going to retreat after testing the major MAs.
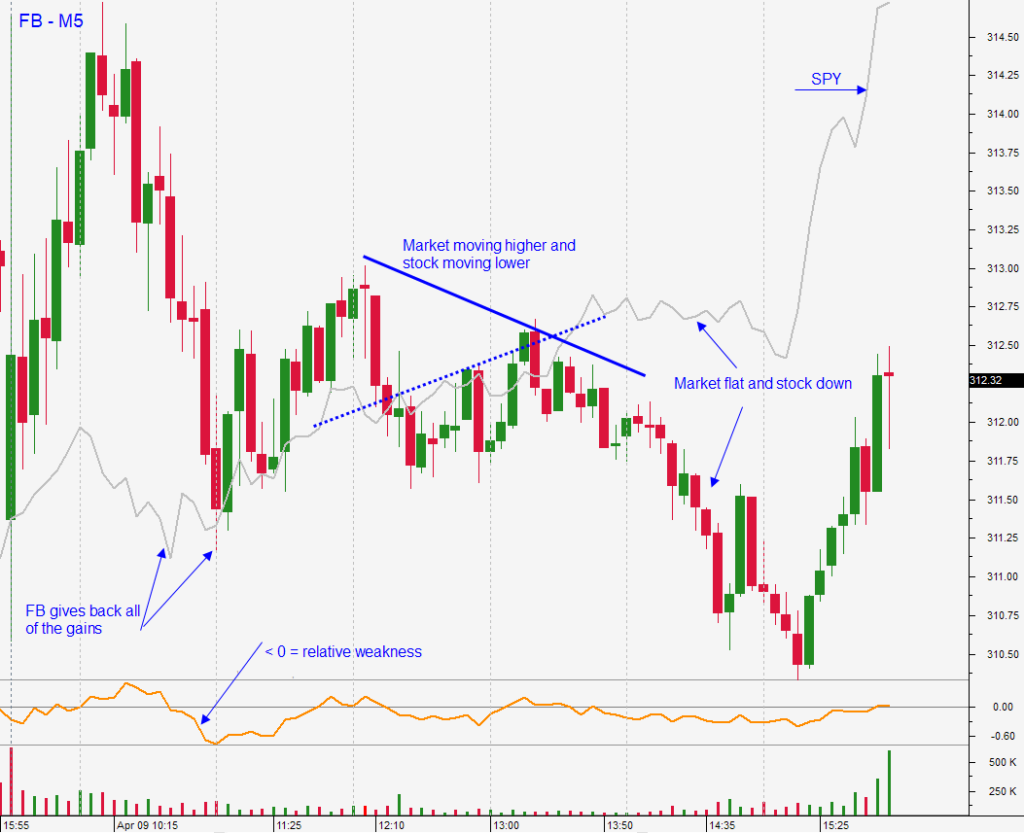
FB has been strong recently as well. It opened a little soft Friday and it shot higher with the market. However, look what happened after that. The stock gave back all of its gains when the market retraced. That is bearish and it is a sign that there is selling pressure. If you bought this stock early in the day you overpaid. By the end of the day you might have decided to stop out for a loss. Luckily, the market had a strong day or the stock would have been down a lot more.
Trading the open presents greater risk and greater reward. I have found that by waiting at least 30 minutes I can improve my trade entry. The market action tells me what type of trading day we are going to have and who has the upper hand (buyers or sellers). I can also gauge the stock’s price movement and I can identify relative strength. I hope this post helps you with your entry. Trade well.