A similar process for Day Trading is used for swing trading. We suggest adding long-term, basic, technical analysis for the SPY and the stock. This can be done visually on a daily chart.
For buying, we suggest looking for technical breakouts through resistance levels (downtrend lines, horizontal resistance, and major moving averages) on heavy volume. We also want to see strong technical support (uptrend lines, horizontal support, and major moving averages) below the stock. This is a sign that buyers are engaged and that the path of least resistance is higher. Once you have this visual confirmation for the SPY and the stock, you can use the process above to find the best stocks and to nail your entry.
Quick tips for first-time Option Stalker users
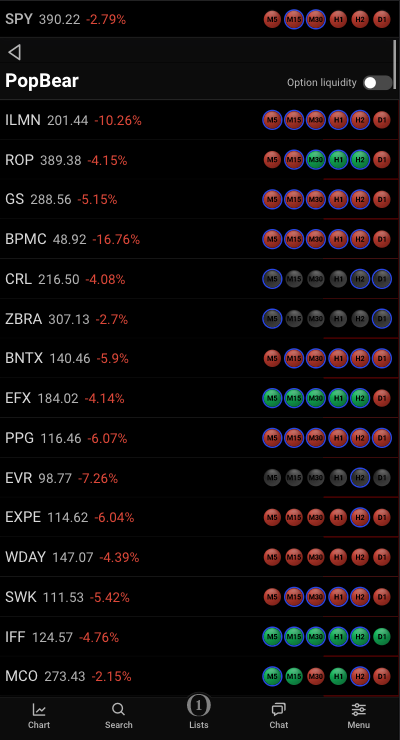
1. Find the SPY signals across the top. Solid colors across indicate trend strength. Green is bullish and red is bearish.
2. Find 3 horizontal dots in the upper right corner – click them. Select the searches that match the SPY. If the SPY signals are green select Swing Bull.
3. Select PopBull and view the results. This is one of our favorite bullish swing searches and it looks for D1 compression breakouts.
4. If you see a stock that has solid green colors, you can click on any dot to view the chart for that time frame. The chart includes our indicators and buy/sell arrows. We suggest focusing on longer-term charts for swing trading.
Learn more with the OptionStalker manual