Most novice traders are taught to think about their exits in one dimension. For instance, the stop should be 1% lower and the target should be 2% higher. This mechanical process does not account for other factors that are impacting the stock. Here are 5 things you should include in your exit strategy.
1. Market conditions
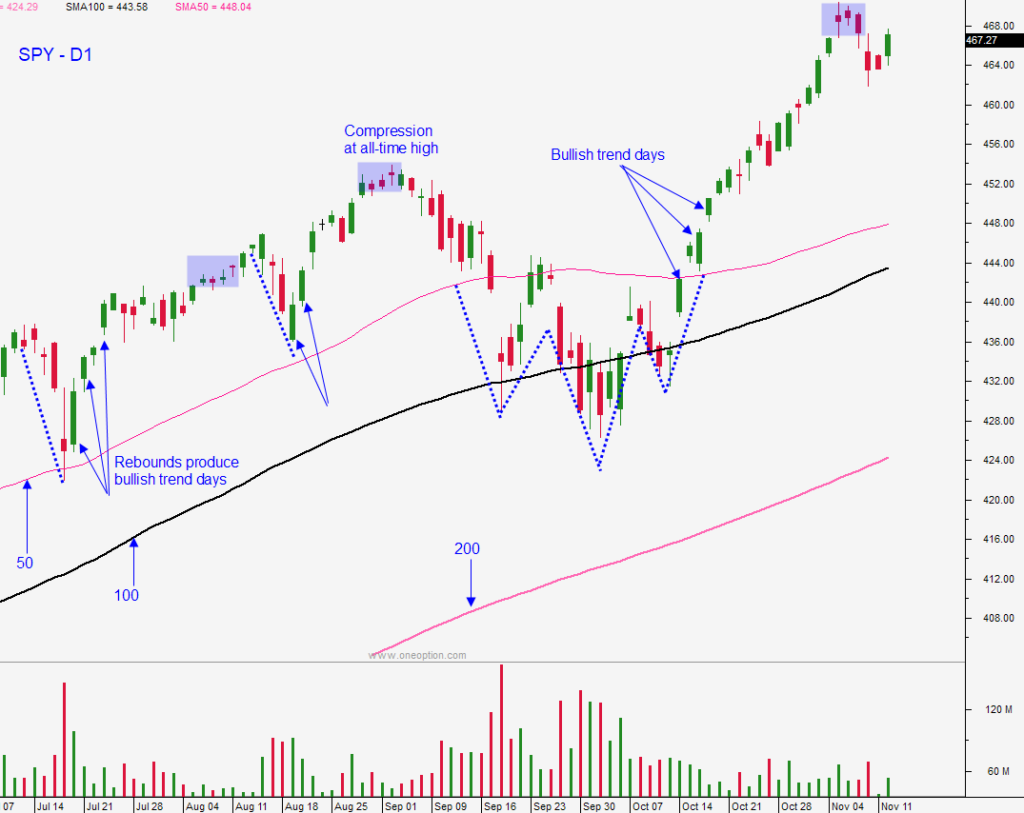
Every trade needs to start and end with the market. I always start with the daily chart to get a feel for the momentum. In the chart below you would be more aggressive buying the bounces off of major moving averages. These dips have been buying opportunities the last few years and once support is established we get a series of bullish trend days (long green candles). That means that you can let your trades run longer because you have a strong market trend working in your favor and the stock is likely to keep grinding higher. When the market makes a new high, you can see how the candles compress and the volume drops off. This means you have a little-to-no market tailwind and you need to set passive targets. During the day you should be aware of key support and resistance levels across multiple time frames.
2. Relative strength
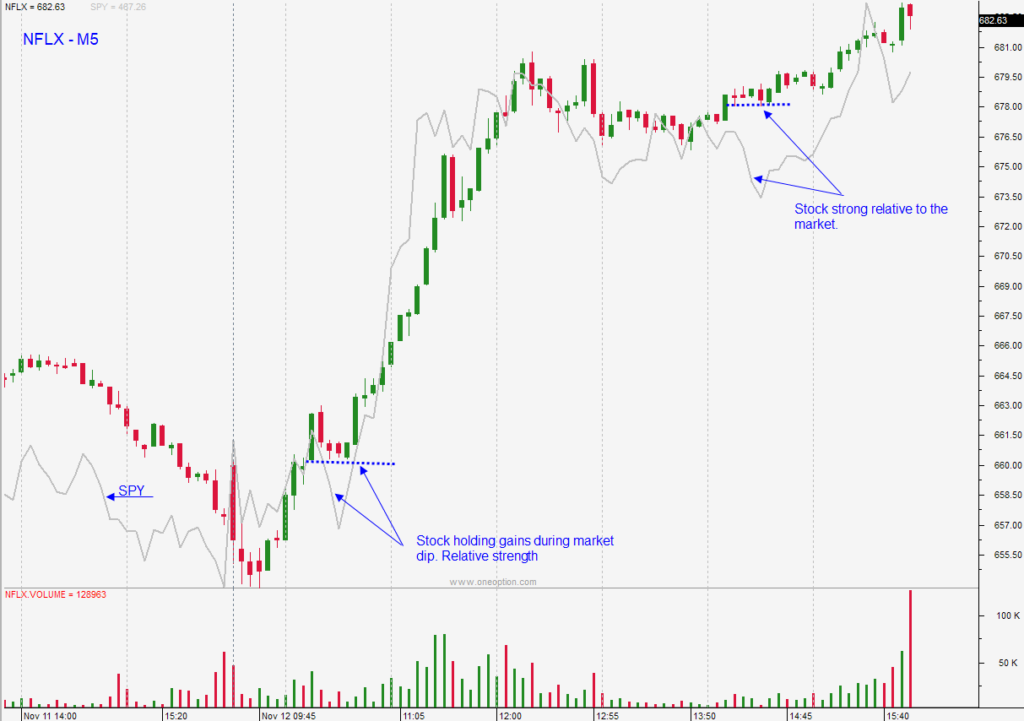
Is the stock maintaining its relative strength to the SPY? I compare the stock tick-for-tick with the SPY. If the SPY is up, then I want to see the stock move higher. If the SPY is flat, I want to see the stock move higher. If the SPY is down, I don’t mind if the stock is down a little, but it has to be holding the bid well. If the stock maintains its relative strength, you should stay in the trade as long as the market dip is not organized and as long as market support is intact. If the stock starts to soften on a market dip, it is a sign to take profits. In the chart below you can see how the market was testing support (dips) and how well the stock held up during those periods. This is a sign that you are on the right side of the trade and as soon as the market regains its footing, the stock will shoot higher.
3. Heavy volume
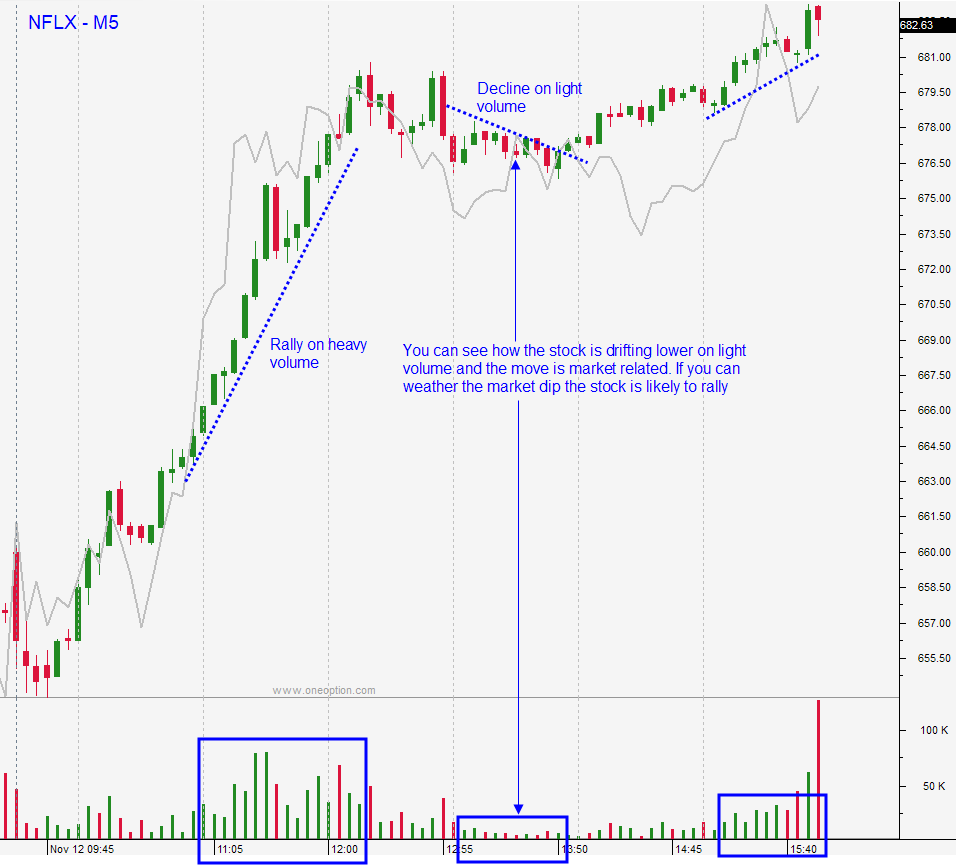
Volume tells you that the current move is gaining traction. If the stock is rising on heavy volume you want to ride that move longer than a stock that has normal volume during a rally. You also want to see declining volume when the stock retreats and you do not want large retracements. Small dips with higher lows are a sign that buyers are still engaged.
4. Technical breakouts
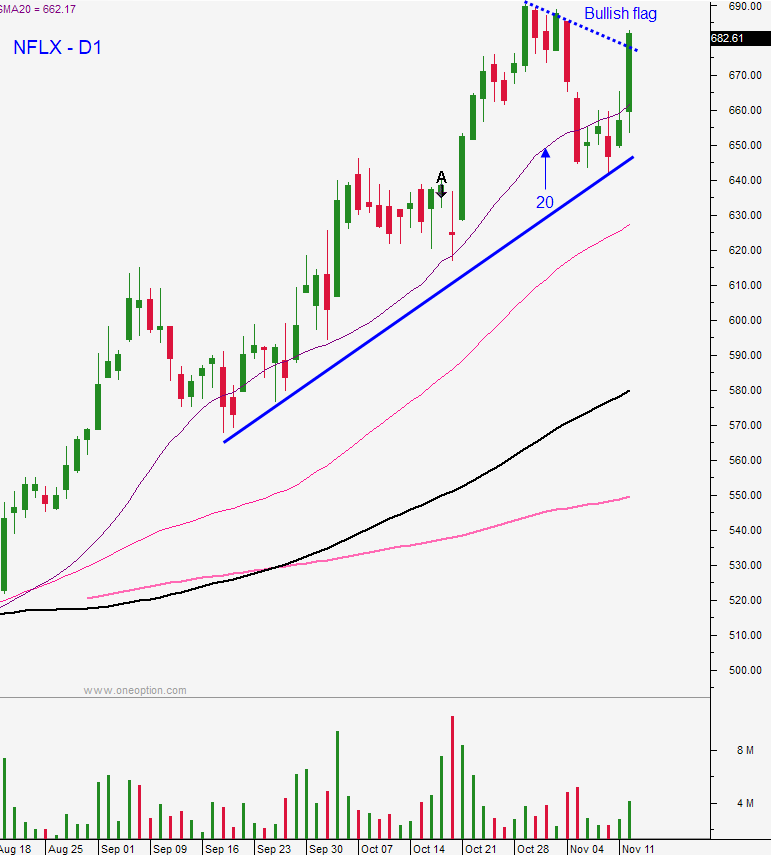
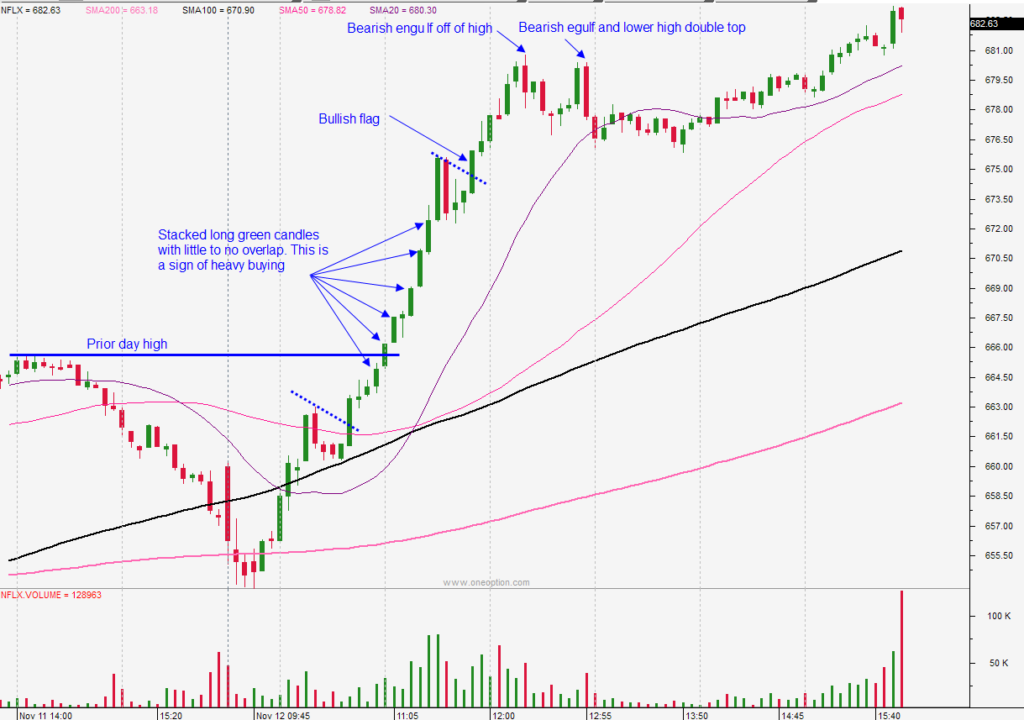
I like to start with a longer-term view. If the market is breaking through technical resistance on a daily basis I will be more aggressive with my longs and I will expect a bullish trend day. If a stock is also breaking through technical resistance I will be more aggressive with my longs. I prefer nice clean breaks through that resistance with little-to-no retracement. Those moves tend to produce nice, orderly price movement and follow through. In the chart below, the stock rallied above the 20-day MA and it also had a bullish flag formation on a daily chart working in its favor. You will also note that it is in a strong trend on a longer-term basis and it was also able to blow through the prior day’s high.
5. Price action
This applies to the price action of the market and the price action of the stock. If the market has lots of mixed green and red candles you know the trend strength is weak. If the market has tiny bodied candles it means the current trend is starting to run out of steam. The same holds true for the stock. In the chart below you will notice consecutive long green candles with little to no overlap. This is a sign of incredible trend strength. It is very important to watch for these patterns because they will determine if you should ride the trade longer or if you should take gains. In the case below, you want to hold the stock as long as you can and you should expect a couple of tiny dips along the way (bullish flags). We also want stocks with nice orderly price action. Avoid stocks with random, choppy price action. Bearish engulfing candles off of the high of the day and bearish engulfing candles are signs to take profits. Double tops with lower highs are also a sign to take profits.
If you factor these elements into your exit strategy, you will know when to let the trade run and when to set passive targets. The market is dynamic and your exit strategy should be as well.
Trade well.