Let’s build on my previous option trading blog. Now that my universe of stocks is smaller, it’s time to use the most powerful tool I own – a trained eye. I click on symbols and I look for very tight price action. I start with a 1W (one week) chart because I want to know that the momentum is there right now. If it is, I will zoom-out and look at the 1M (one month) chart. If that looks interesting, I will zoom-out to the 1Y (one year) chart. At any point in the process, if the chart does not meet my criteria, I’ll quickly move on.
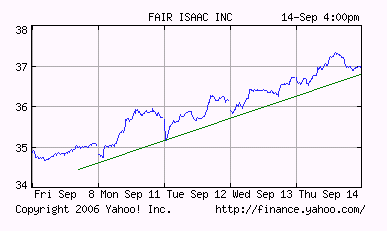
In the 1W chart I’m looking for a nice tight trading pattern where the stock is grinding higher. You don’t see it often, but I describe the ideal chart as a 45 degree angle that was drawn with a ruler. As I’m flipping through, I’m mindful of what the overall market has done. Remember, I’m looking for relative strength. If I’m looking at bullish search results I want to see how the stock reacted to a down market and I’ll focus on those days. For instance, yesterday was a mildly weak opening and I want to see if the stock buckled or continued higher on a path of its own. If there was a gap formation, I want to see the stock hold the gap and continue to move in that direction.
Here is a stock that showed those properties yesterday. Notice the green trend line and how tight it is. When it is moving in one direction like this without much volatility, it tells me the buying is strong. Think of it. Stocks usually chop back and forth in a flat market. If the stock gets ahead of itself, sellers step in and they keep the stock in a range. In the case of FIC, every time a seller posted an offer, there was a willing buyer who stepped up. Yesterday morning, the stock just kept marching higher.
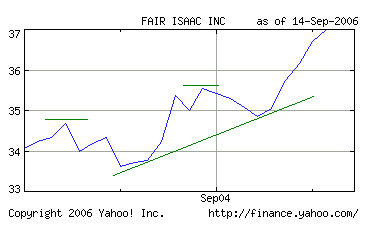
This stock has passed the 1W test so I will zoom out and look at the 1M chart. In the 1M chart I am not as particular about what I see. In the case of a bullish stock, I don’t want to see a big drop or a tremendous amount of volatility. Rather, I would hope to see a trend forming, some support and possibly a breakout to new 1M highs. You can see that all of those qualities are present in the next chart. I have drawn the points of interest in green.
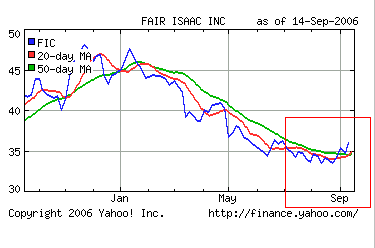
Now that the stock has passed the 1M test I will zoom-out to the 1Y chart and get a long term view of how the current price action fits into the big picture. There are many formations I look at and this is where my hierarchy helps me. In the case of a reversal, I want to see that a base has formed for an extended period of time and that the moving averages have flattened out. I would also like to see that the stock has taken out a short term resistance level. In the chart below, you will see all of those characteristics. The red box helps us put the move into perspective. Notice the support level at $34 and that the 20-day moving average has crossed over the 50-day moving average.
This stock has simply passed this part of the test. It normally takes me 40 minutes to get through all of the 300-400 symbols and I’m left with 20 solid (10 bullish, 10 bearish) candidates. I start my search 2 hours before the close so that I have as much data as possible. Many of my searches build throughout the day and the “head fake” stocks fall off of the search results. All I know at this point is that technically the stock looks promising and it has relative strength. Trading boils down to your ability to predict price movement. That is why we are looking for specific price behavior and patterns.
Now, my focus shifts to a different type of analysis. I will lift up the hood on these 20 stocks and see what’s making them tick. My next article will discuss the next step – fundamental analysis.
Take a look at FIC. It may present an opportunity.