Originally written for r/RealDayTrading Dec 25, 2021
In Part 1 of this article I started with a longer term view of the market. Now it is time to shift your focus to short-term market analysis. Day traders need to form a market opinion for the day. The first step is to put the current day’s price movement into the longer-term context and the next step is to interpret the intraday price action for the SPY.
When we talk about context it is the macro backdrop and the pre-open market move that come into play. Here are some recent examples:
The market is gapping higher, am I inclined to chase this move if I see stacked green candles? If I was asking myself that question 10 days ago (when SPY was at an all-time high) the answer would be – no. Gaps up to the all-time high have typically been faded and I can expect a gap reversal. If I was asking myself that question Tuesday (SPY near major support) the answer would be – yes. The market had bounced off of the 100-day MA the day before and it closed on the high of the day. Buyers have consistently bought these dips in the past and seasonal strength is working in my favor along with the long-term market uptrend.
The market is gapping down, am I going to look for shorting opportunities on the open? First of all shorting has been very difficult because of the strong seasonal bias and the long-term (12 years) market uptrend. Bull markets die-hard and these drops typically find support. Is the market going to open below the prior day’s low? Is the market going to test a major D1 technical support level? How did overseas markets perform? Was there some type of news that could be sparking profit taking overnight? These are the questions you have to answer. I would be more inclined to short near the all-time high (resistance) than I would be at the 100-day MA (support). My conclusion might be to wait for dip buyers to come in and to wait for that bounce to stall. If it falls way short of filling the gap and the bounce is brief I will know that the selling pressure is strong and those dip buyers will be flushed out. That initial bounce will provide an excellent entry point for shorts (example below).
Most days I want to watch the open and I want to let the price action unfold. Buyers and sellers will test each other and after 30 minutes of trading I will be able to form a market opinion for the day.
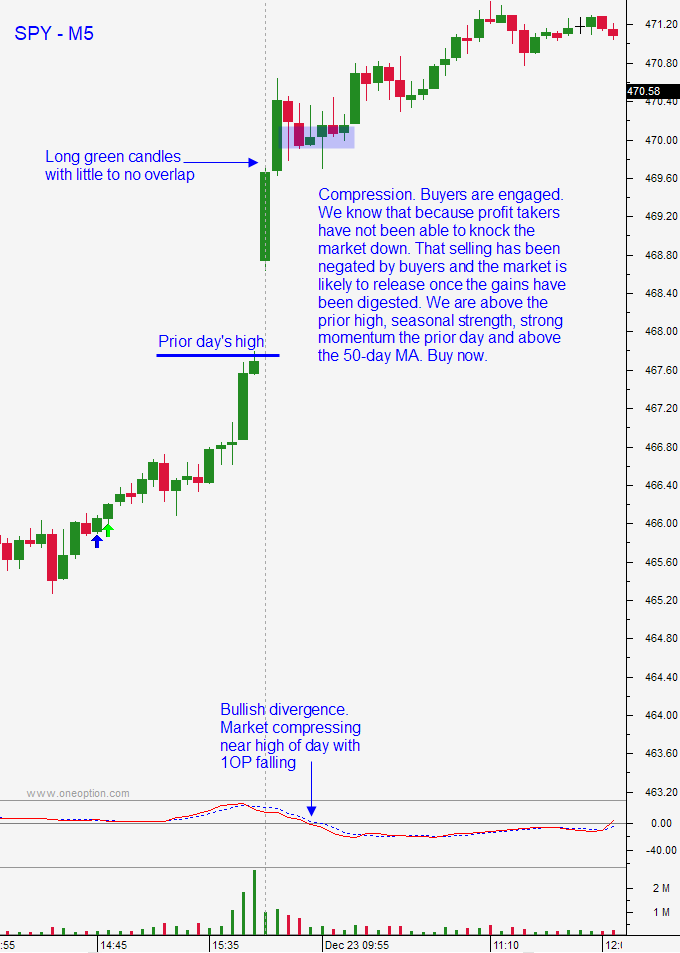
Consecutive long green candles stacked with little to no overlap is very bullish and the opposite (red candles) is very bearish. Long candles that retrace are a sign of uncertainty and volatility. A good move is likely, but it will take time to determine direction. Tiny mixed green candles are a sign of equilibrium and a dull day is likely. These are the keys that unlock your trading day.
Position sizing is a common topic. I use a constant dollar amount so that I buy fewer shares of expensive stocks and I buy more shares of less expensive stocks. There are many books written on the topic and not one of the methods resonated with me, so I have my own method. My size is based on my market opinion and my confidence in it. I will try to write more about this in the future, but the concept is pretty simple. If the SPY is trapped inside the prior day’s range (“inside day”) and we are inside of the first hour’s range with mixed candles and light volume, I am going to trade a smaller size. If the market is gapping higher on heavy volume after confirming major D1 support (like 12/21/21) and it is above the prior day’s high and a major D1 resistance level during seasonal strength, I am going to trade larger size. Please don’t ask me a bunch of questions on position sizing, I keep it quite basic and I do NOT consider a stock’s volatility (although you might). My sizing ranges from 1/4 of what I consider to be a full position to a full position. If your long term win ratio is greater than 75% for day trades you can use a part or all of your account. If you do not have that win ratio you should trade 1 share until you get there.
I rarely like to trade during the first half-hour of the day. Those first 30 minutes are filled with noise and programs are testing the bid and the ask to see who has the upper hand. There is valuable information in those first bars and they will help me confirm/reject my game plan. Last Thursday (12/24/21) I saw two stacked green candles with no overlap. That is bullish, but I needed proof that this was not going to be a gap reversal. Over the next 30 minutes of trading, I could see that the open from the second green candle had held and that buyers were supporting the move higher. How do I know this? You can see that the opening gap was holding. If this move was a giant head fake we would have seen profit taking and red candles. We did not see that and even the gains from the opening print were holding. Now we were seeing some tails under body (another sign of support). The final confirmation was that 1OP was declining while the market compressed near the high of the day. This is something we call a bullish divergence and it was a sign that the market was going higher.
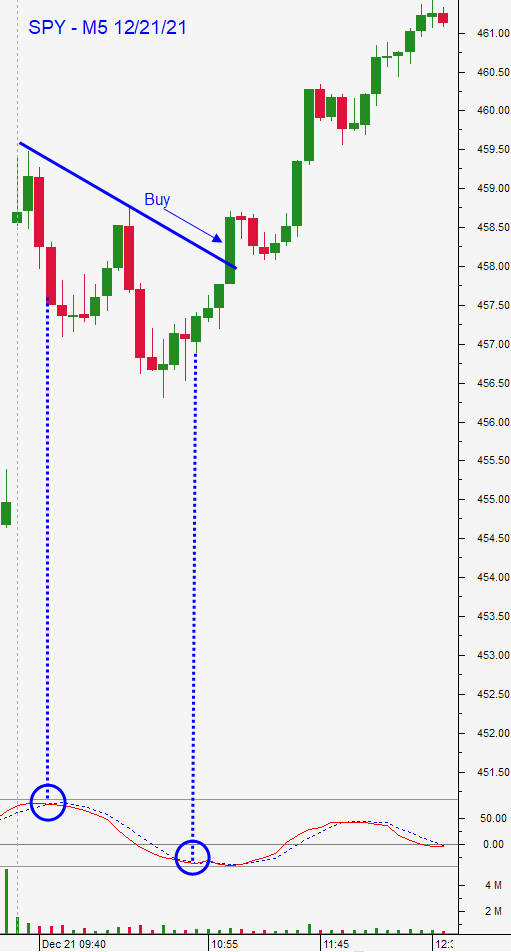
Here is another example of the opening price action (Tuesday 12/21/21). The market had tested the 100-day MA the previous day and we had an opening gap higher during a seasonally strong period. These dips to support have been bought aggressively over the last two years. YOLO bullish specs bought the opening gap higher and were flushed out when it looked like the opening gap would fill. The first two long red bars suggested heavy selling because there was no overlap. This told me that we still needed to probe deeper (or that we needed to spend more time) to find support. Those early red candles were almost erased by the next candles and we rallied above the open for the first red candle. This is a sign that buyers are engaged, we just had to wait. The next two red candles made a new low of the day, but it was a marginal new low (not substantially lower than the previous low of the day). That was a sign that support was forming. The next series of green candles confirmed that the market was going higher. Much of the opening gap higher was preserved and buyers stepped in before the gap was filled. That is because they did not feel like they would have a chance to enter that low and they were aggressive. The long green candle that appeared 90 minutes after the open accomplished two things: 1. It broke the downward sloping M5 trendline 2. It cleared the open from the prior two red candles. It came on a bullish 1OP cross and it was time to buy.
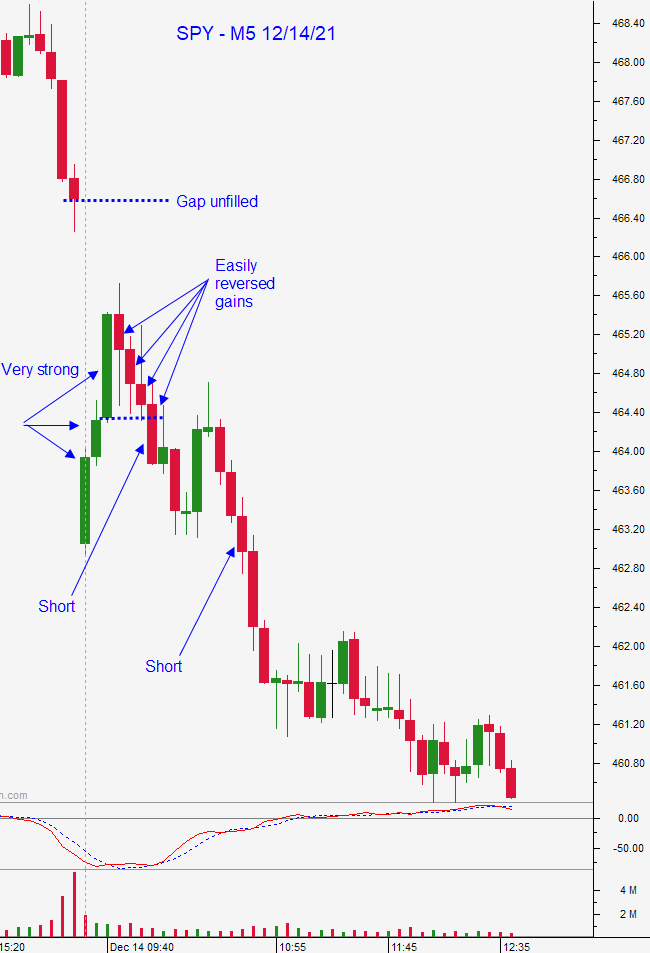
Here is another example of how the long-term and short-term market analysis helped me game plan my day. On December 13th the SPY sold off hard after testing the all-time high resulting in a long red candle. A closer look at a daily chart reveals that the market typically has follow-through selling after this pattern. Buyers are less aggressive after that price action and there will not be a sustained rally until support is confirmed. The next morning the market was gapping lower. Dips have been bought indiscriminately by novices and I was waiting for a bounce that would stall. This was the optimal “set-up” and I wrote about it before the open. I was going to let bullish speculators rush in and I expected that the door would be slammed and that the bounce would easily fail. The opening bounce (long green candles) was brisk and the move looked legitimate to those who did not consider the longer-term context I outlined. The “tell” was that the gap did not fill and that the retracement was equally brisk. The open from the last long green candle failed easily and we were stacking red candles. The next red bar retraced almost all of the green candles and that was a great entry for shorts. After a brief and tiny bounce, the SPY took out the low of the day and that was an entry point where you could safely add to shorts. Bounces that are brief (20 minutes) and shallow are a sign of heavy selling. We also had a bearish 1OP divergence to confirm that the market was going lower.
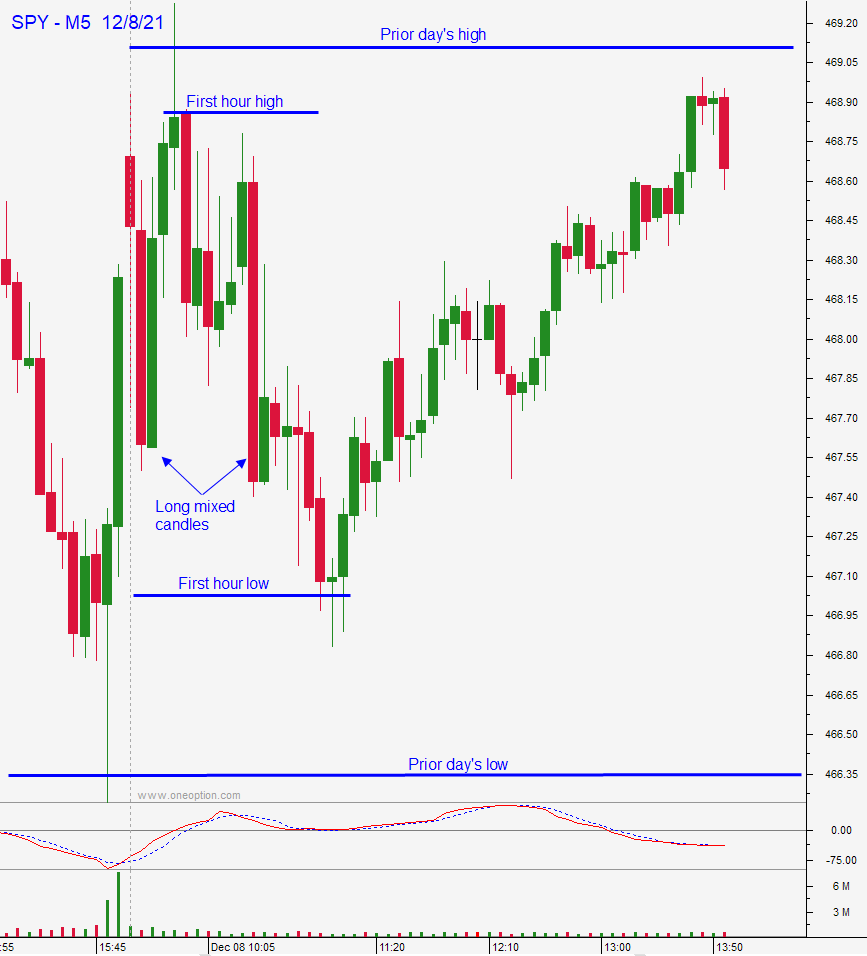
One final example from December 8th. The context is that the market was bumping up against resistance at the all-time high. The market was in a holding pattern ahead of a critical FOMC statement in a few days. The early action was random chop. We had long red candles and long green candles mixed and the market was inside of the prior day’s range and inside of the first hour’s range. This is a warning sign that there will not be a sustained directional move and that you need to trim your size and trade count.
I don’t post these examples to brag, this analysis actually happened in real-time and we did these trades in the chat room. I want you to know that this analysis works and it is not a bunch of BS. Many members of this sub also belong to my chat room and they will confirm my posts or reject them if I start posting crap (never). This is the type of analysis you need to conduct if you want to become a good trader.
The first two parts of the decision-making process are market-centric. Your long-term and short-term market opinion are so critical that I would consider the first two steps to be 70% of the entire day trading puzzle. Get this piece right and your odds of success increase exponentially. Get the market wrong and your chances of success are slim.
Continue Reading:
Previous Articles: