Originally written for r/RealDayTrading Dec 25, 2021
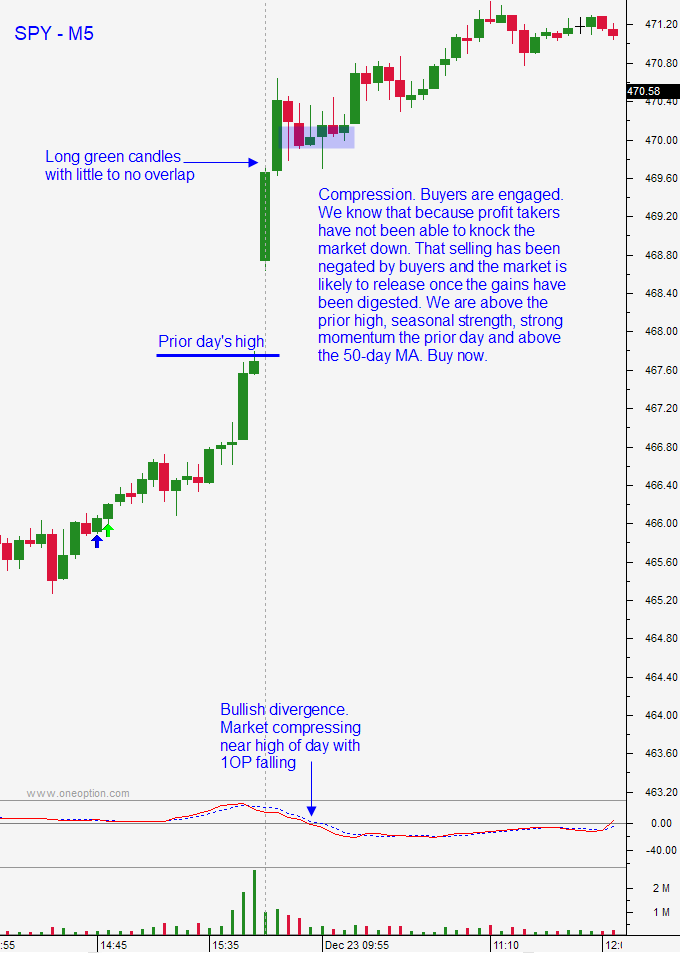
In Part 1 and Part 2 I completed the most critical part of my analysis and I now have my longer term and shorter term market bias for Thursday December 23rd. I feel that seasonal strength and a bounce off of the 100-day MA fueled a rally through the 50-day MA. The market closed on the high of the day yesterday and we will have follow-through buying today. The SPY is gapping higher and the volume will be light ahead of an exchange holiday. I need to tread cautiously on the open and I need to make sure that the gains are holding. While I wait for market confirmation I will look for stocks that have great D1 charts. During that time I do not want to see long red candles stacked consecutively with little to no overlap. That would indicate a gap reversal and heavy selling. A slight dip would be fine as long as most of the gap higher is preserved.
The stock I am looking for will have D1 relative strength, a technical breakout and heavy volume. It is also likely to have other characteristics I like, but this is the minimum. Longer term strength is important because it tells me that I have a strong tailwind. If my entry is less than ideal, I have the staying power to weather a dip in the stock or an adverse market move. My intention is not to turn a day trade into a swing trade, but I could if I wanted to (this notion will help you take some of the emotion out of the trade and you will be more confident in the trade).
In general, you want to buy stocks that are closer to the 120-day high (upper right corner of the chart) and short stocks that are closer to the 120-day low (lower right corner of the chart). You want as many desirable characteristics (checkboxes) as possible.
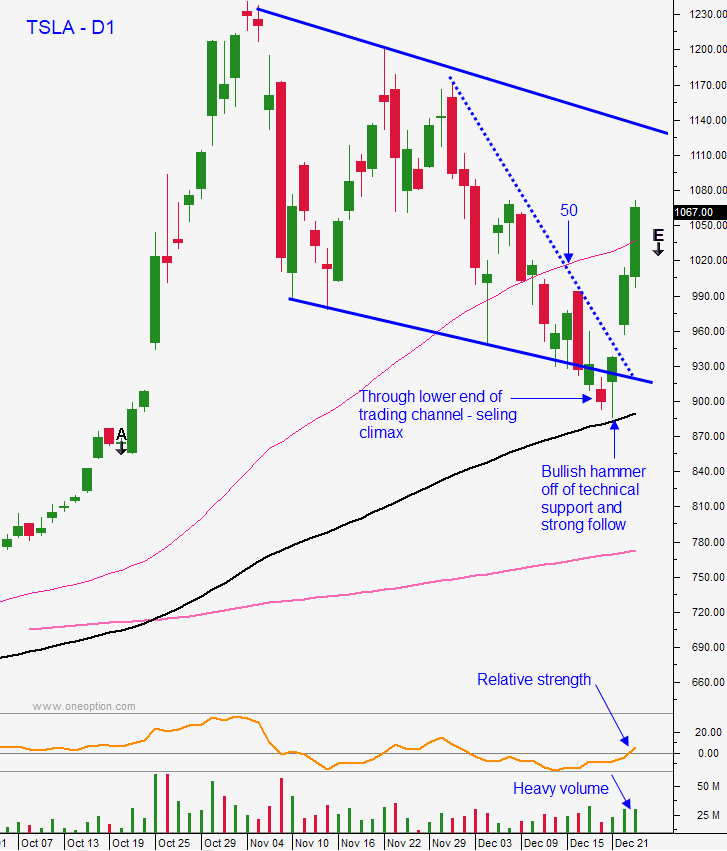
December 23rd I found TSLA. To be honest, TSLA is always on my radar because it moves well and it has great option liquidity. It was in a downward sloping channel and the lower end of that channel had been breached. This typically results in a selling climax and these reversals often retrace back to the top of the channel. The 100-day MA was preserved and a bullish hammer resulted. Off of that bounce, TSLA opened on the low and closed on the high (long green candle) with heavy volume. It was through a downward sloping D1 trend line and it was likely to challenge the 50-day MA. While I was waiting for the market to confirm support (gapped higher on the open) I was going to track TSLA. If the market pulled back, I wanted to see TSLA tick higher. If the market compressed, I wanted to see TSLA tick higher. This would confirm that buyers were still engaged and that TSLA was strong relative to the market.
The trade was shaping up, but I had to be patient – Part 4.
Continue Reading:
Previous Articles: