Daily Stock Option Trading Strategy
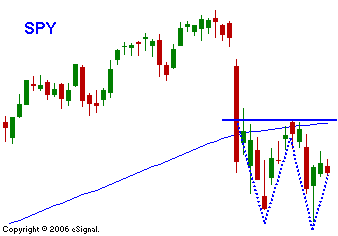
The market has shown its resilience this week and it has erased half of last week’s losses. That is a typical retracement for big declines. That percentage “bounce” also happens to correspond to a few other key technical levels. I’m not a big fan of Fibonacci, but in this case it works. SPY 141 is the 100 day moving average and it also represents a horizontal support/resistance level. In short, many traders will eye this level and consider it a pivot point or a short-term top. I selected a weekly chart to show how big last week’s move was. Notice how the steep uptrend line was broken. From a traders perspective I will remain bearish until I see a convincing close above SPY 141. At that point I will be neutral and move to cash. I feel a warning shot has been fired and I do not believe that it has received the attention it deserves. Retail traders have been convinced to stay the course and margin debits remain high. They have exhausted their buying power and they need to be washed out. The option implied volatilities have also dropped so selling strategies are not advised with the elevated risk levels. If the market can continue to climb over the next month, the wound will have healed and I will dismiss it as an over-reaction. If the market can’t get through this key level, I will favor buying puts now that the IVs have come in. I see the greater risk as being to the downside at this juncture. The opening rally hit some resistance and the downside was tested. The bulls and the bears have drawn the battle lines and I would expect today’s range to hold. If either side is broken in afternoon trading, look for continuation into the close. 
Daily Bulletin Continues...