Daily Stock Option Trading Strategy
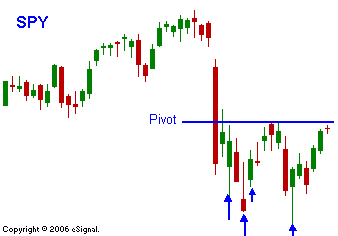
Yesterday the bulls were unable to erase the early losses and push the market higher. By mid-morning the bears took charge. As the selling progressed, buyers pulled their bids and stocks headed lower in an orderly manner. Quad-witching is adding to the volatility and once traders are able to confirm a directional move, they legged out of hedged positions as they rolled into future contracts. This action keeps the momentum going throughout the day. As expected, our sell-off spread to global markets. Asian markets were down 3% and Europe was down 2%. Liquidity has a multiplier affect and when times are good; money ripples out into the economy. When times are bad, there is a domino affect as lenders try to collect. Retail traders who have been convinced to "ride out the storm" are swallowing a bitter pill. Last week they were fortunate to get a bounce. Rather than view it as an opportunity to sell, they saw themselves one step closer to being "whole" again. The market will test the lows made last Monday. My suspicion is that the lows will be taken out in the next week or two. The market has fallen very sharply and there are some legitimate worries. If you're a trader, don't listen to CNBC. The "tape" is telling you that there is a great deal of uncertainty. This sharp drop might form a "V" bottom, but your account will be wiped out in the process. Today the bulls are trying to tread water and they have not even generated a decent bounce. That spells trouble for afternoon trading and the path of least resistance is down. The PPI/CPI would normally have some impact, however, inflation has been kept in check and it is not a major concern. The problem is that a "hot" number would be very bearish since it would keep the Fed from easing in July. I will continue to stay long puts and as I mentioned yesterday, below SPY 138, I'm adding. The quicker the market falls, the more likely I am to take profits. Being long puts has another kicker; the IVs are going up so you are rewarded in two ways. In today's chart you can see how the SPY formed resistance at the 100-day MA. 

Daily Bulletin Continues...

