This is a guide will help you get the most out of the OneOption Trade Signals
Introduction
Developing accurate Trade Signals has been an obsession of mine for well over a decade. It’s what motivated me to start developing Option Stalker Pro during the 2008 financial crisis. I had concepts that I wanted to test, but to do this I needed to gather data to create my own variables. The only way to do that was to develop my own trading software. Fortunately, when I started this journey, I didn’t know how difficult it would be. Each new iteration and concept seemed like it was the solution. When I look back at all of the testing, refinement, failure and expense, I would not have the wherewithal to do it again. I’m very excited to release our trade signals, but I want to make something very clear. As good as they are, this is NOT the “Holly Grail” of trading. I would not advocate simply following the buy and sell signals. Your trading skills will also play an important role in your success.
I’ve written about the 1OP Indicator extensively and it proves itself daily. It is predictive and not reactive, but it has divergences about 20% of the time. The indicator requires interpretation and we still use it to trade and to help us time market cycles. After years of experimentation and testing, 1OP was reconstructed to eliminate the divergences and it is the cornerstone for the new buy and sell signals.
Why the obsession with trade signals? Every trader wants to develop their own proprietary trading algorithms. Are these good enough to automate? Time will tell. I’ve been through enough trials and tribulations to temper my excitement. What I do know is that they are timely and accurate. At minimum they are a primary consideration for every trade. Trust is established over time and the more you use them the more you will rely on them. So here are some suggestions on how to use them.
Overview
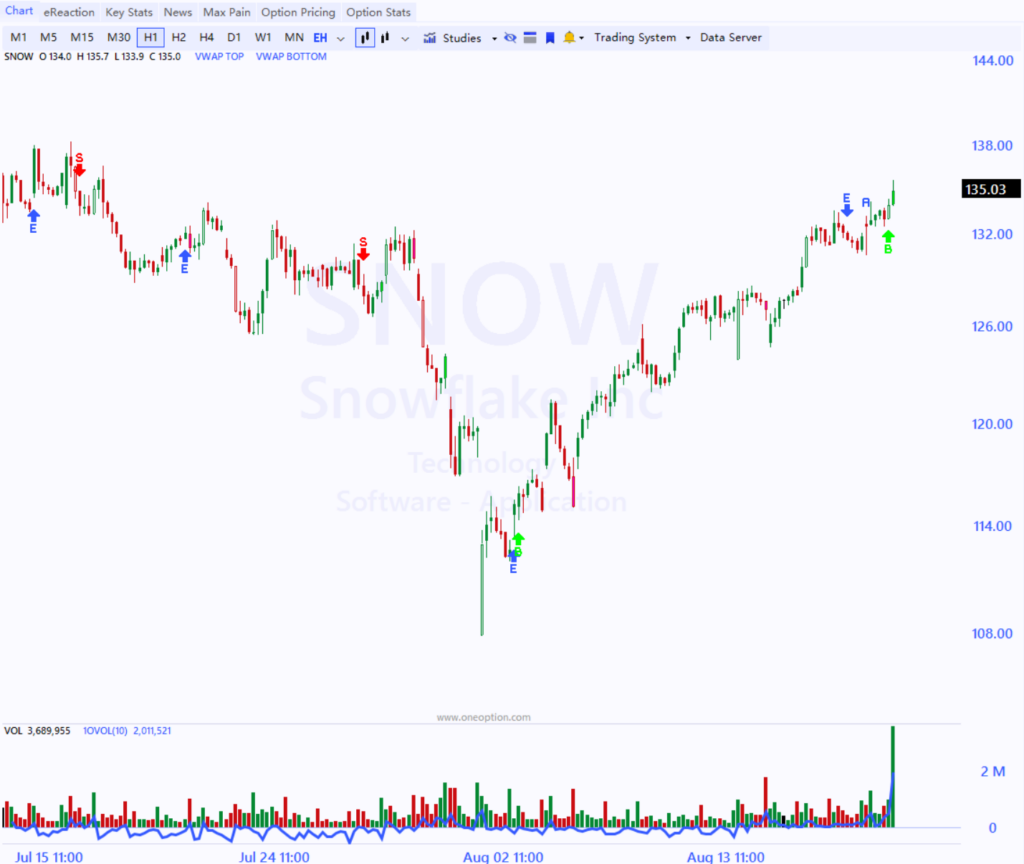
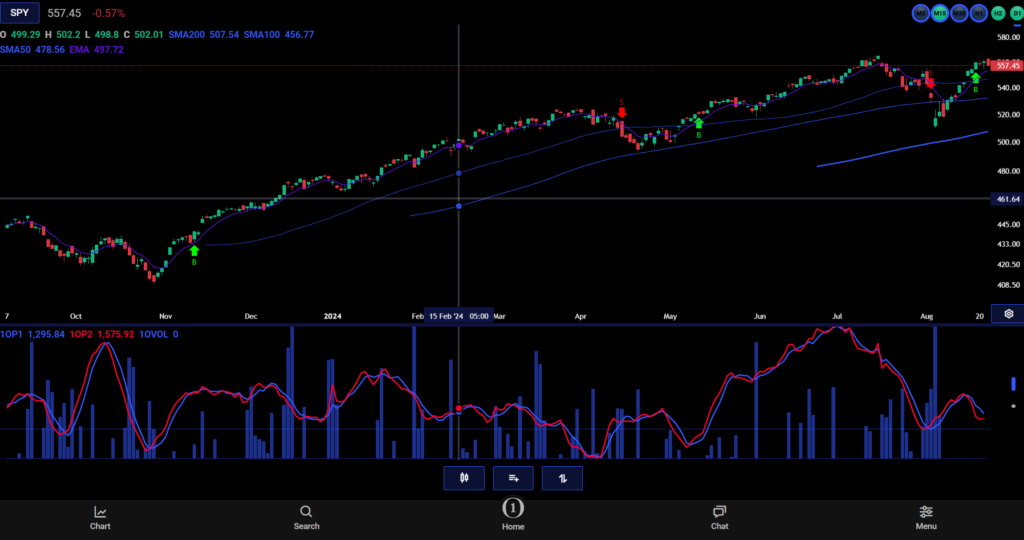
We do not have trade signals for MN (monthly) or W1 (weekly charts). Those time frames are extremely long-term and they are suited for investing and not trading. We also do not offer M1 (one minute) trade signals. They are too granular for our purposes. The trade signals appear on the charts for M5, M15, M30, H1, H2, H4 and D1. A green arrow is a buy and a red arrow is a short. On a D1 chart (daily candles) the signals pivot from long to short. For M5, M15, M30, H1, H2 and H4 we have blue exit arrows. If you are a longer-term swing trader you would lean more on the D1 and H1 trade signals. If you are a day trader, you would lean more on the M15 and M5 trade signals. There will be times on the shorter time frames when a buy signal is followed by a sell signal or a sell signal is followed by a buy signal. That is not an error, the system is pivoting and skipping the blue exit arrow. This is what the Trade Signals look like.
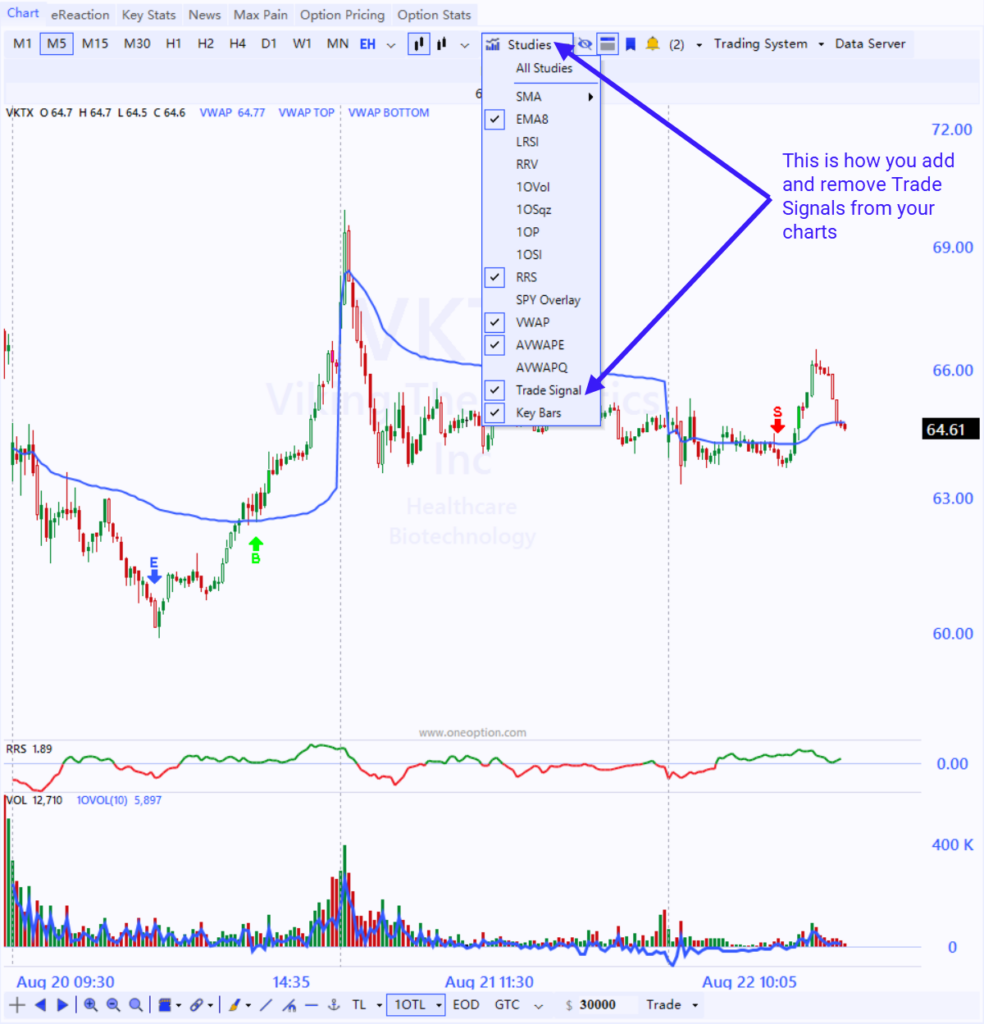
It is easy to add and remove the trade signal arrows from your charts in Option Stalker Pro. At the top of the chart, select Studies and in the quick dropdown you will find “Trade Signals.” This is where you can add and remove them from the charts.
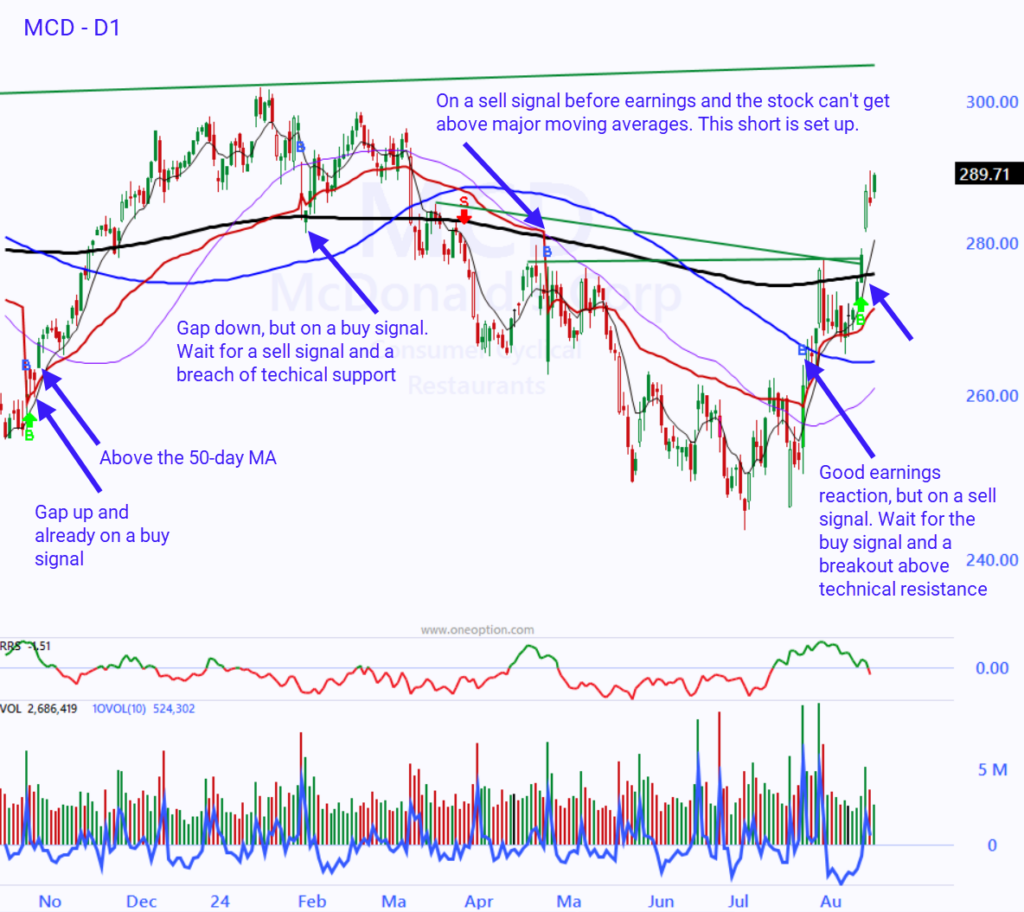
If you are swing trading, I suggest exiting before earnings announcements. That is a binary event and we don’t know the outcome. Sometimes the signals heading into the number are right and sometimes they are wrong. If the signal gets the earnings reaction right, there might be a good trade that sets up immediately if the stock has also breached key technical levels. If the signal is wrong, don’t consider a trade until you get a trade signal that agrees with the move. Again, the trade signals are not designed to predict an earnings reaction, it was just easier for me to explain how to trade after the reaction using the phrases “right” and “wrong”.
If you are a day trader, I suggest exiting before the close. Sometimes the trade signal will be right overnight and sometimes it will be wrong. We can’t predict what will happen overnight so we won’t take credit or blame for those moves. You have to decide if you are willing to accept the overnight risk.
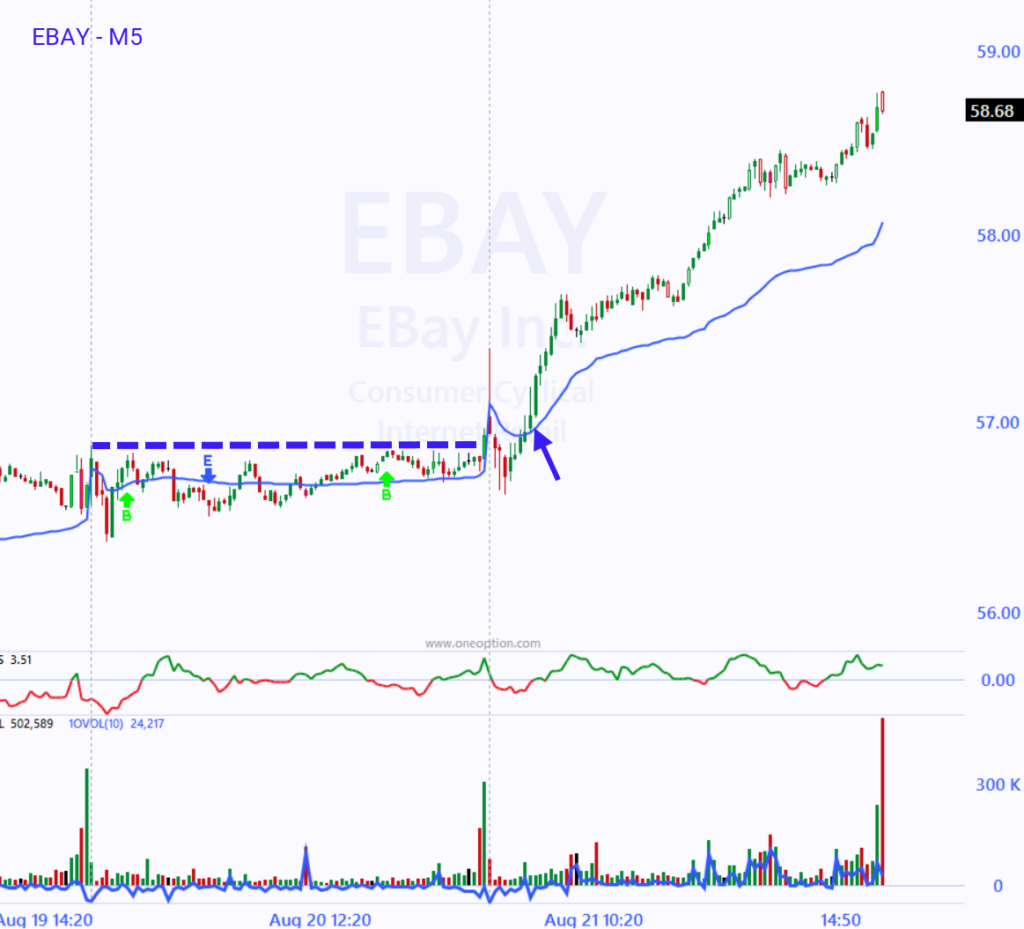
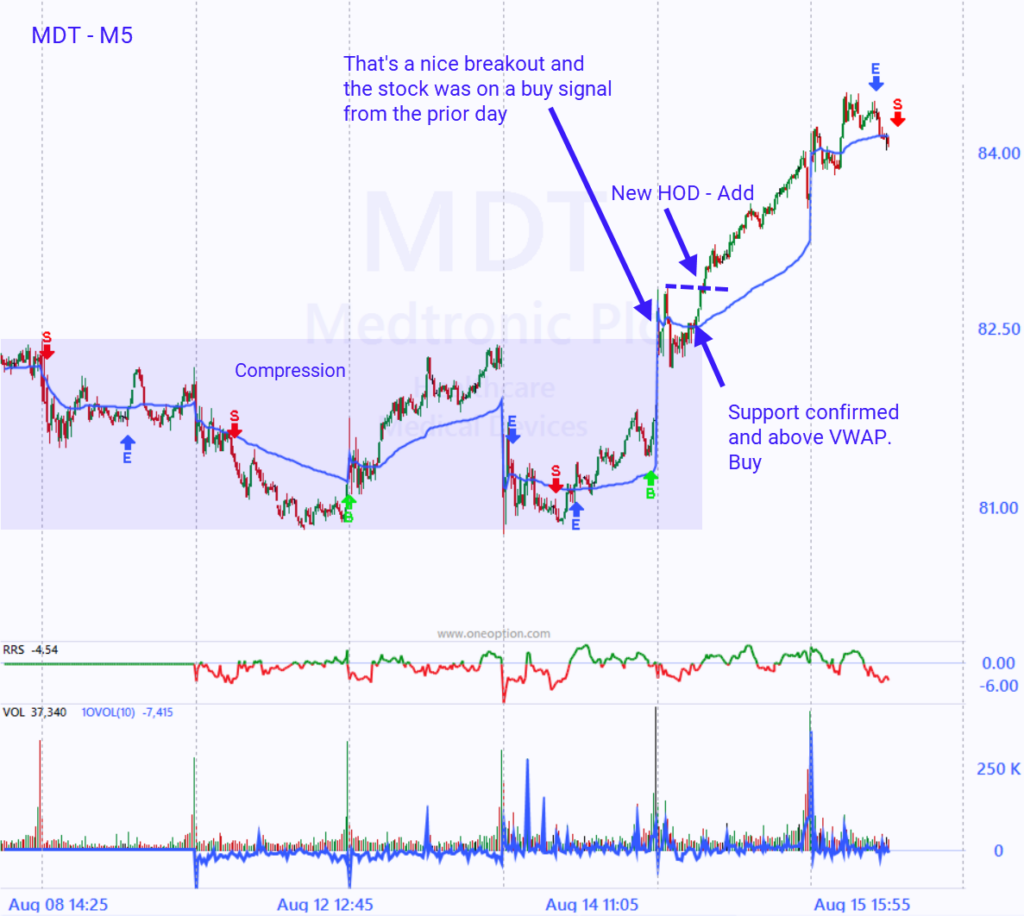
For day trading I would not take signals that appear late in the day. There is simply not enough time for the move to materialize and you are painting yourself into a corner. What I prefer is to take a trade signal that appeared the prior day and where the stock continues in that direction the next day. In the chart below, the stock was on a buy signal the prior day and it was in a compression. The next day the stock rallied above the prior day’s high and above VWAP. That gave the stock all day to perform.
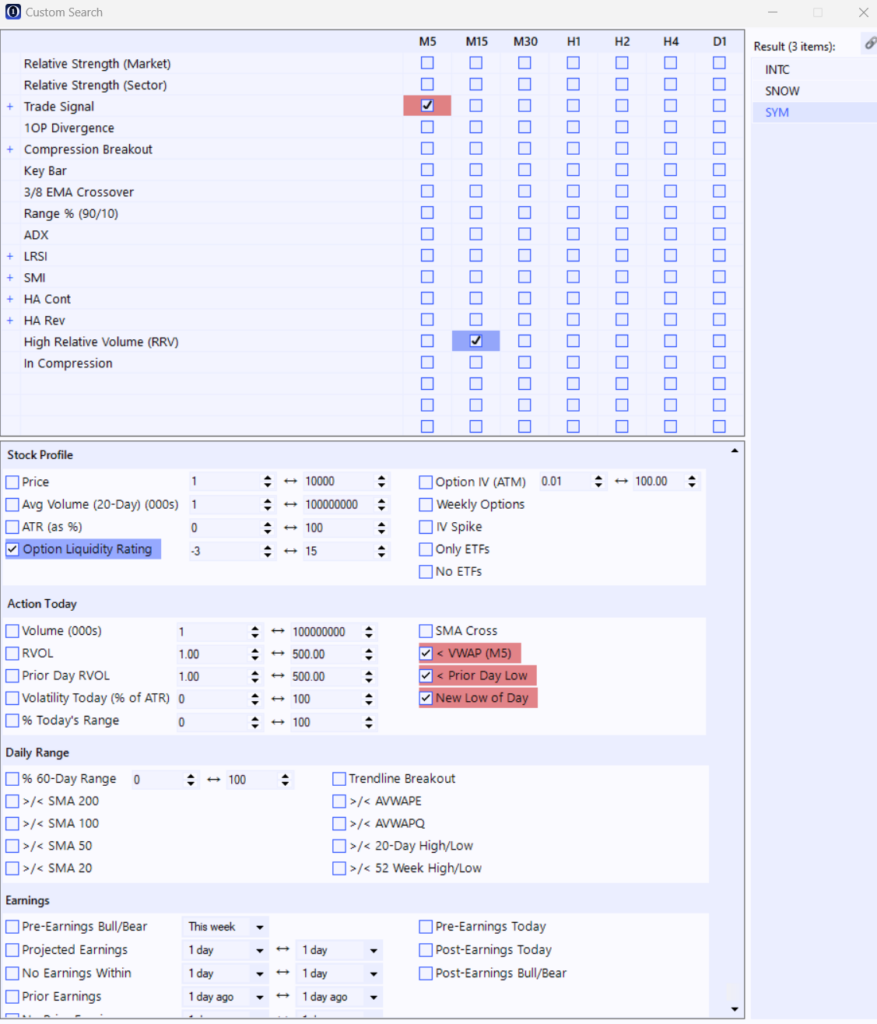
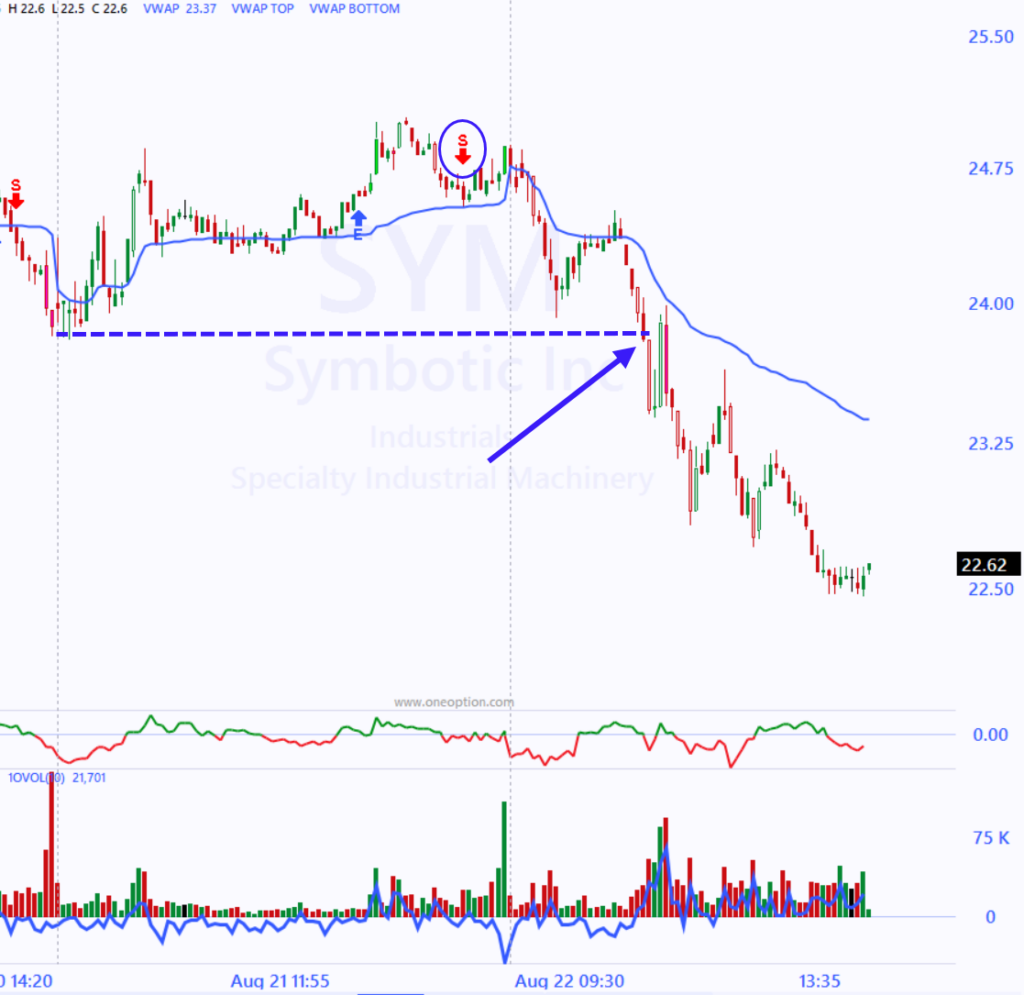
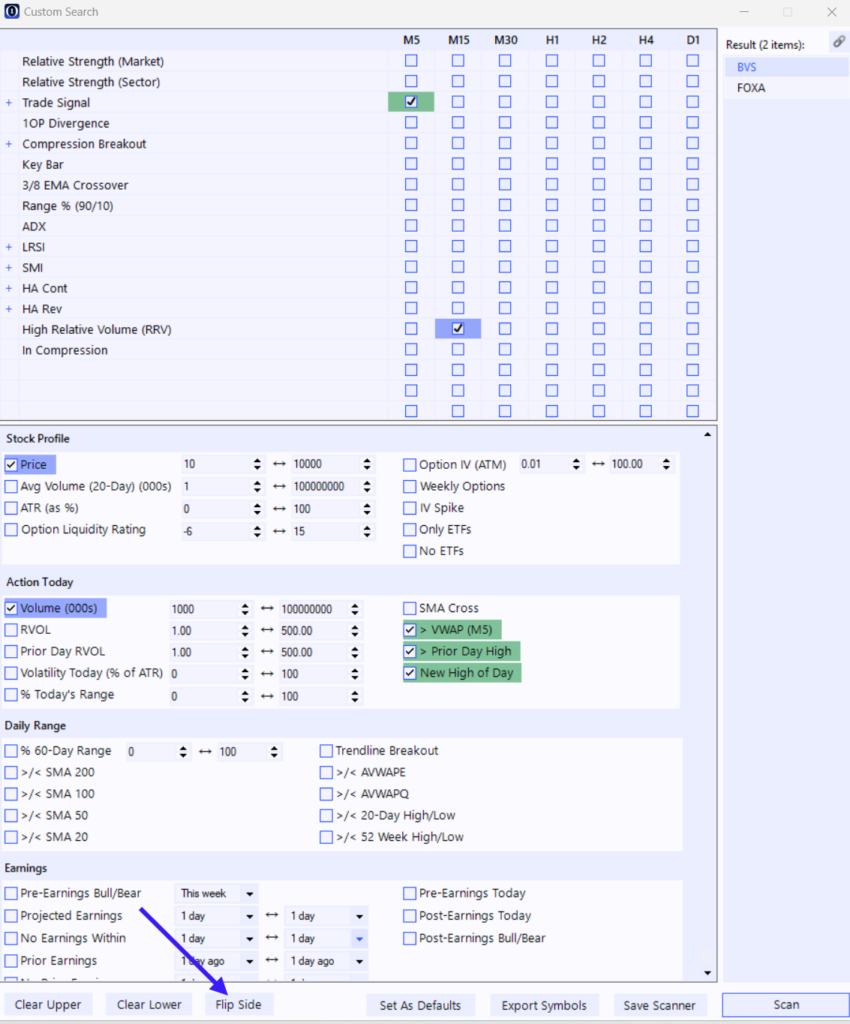
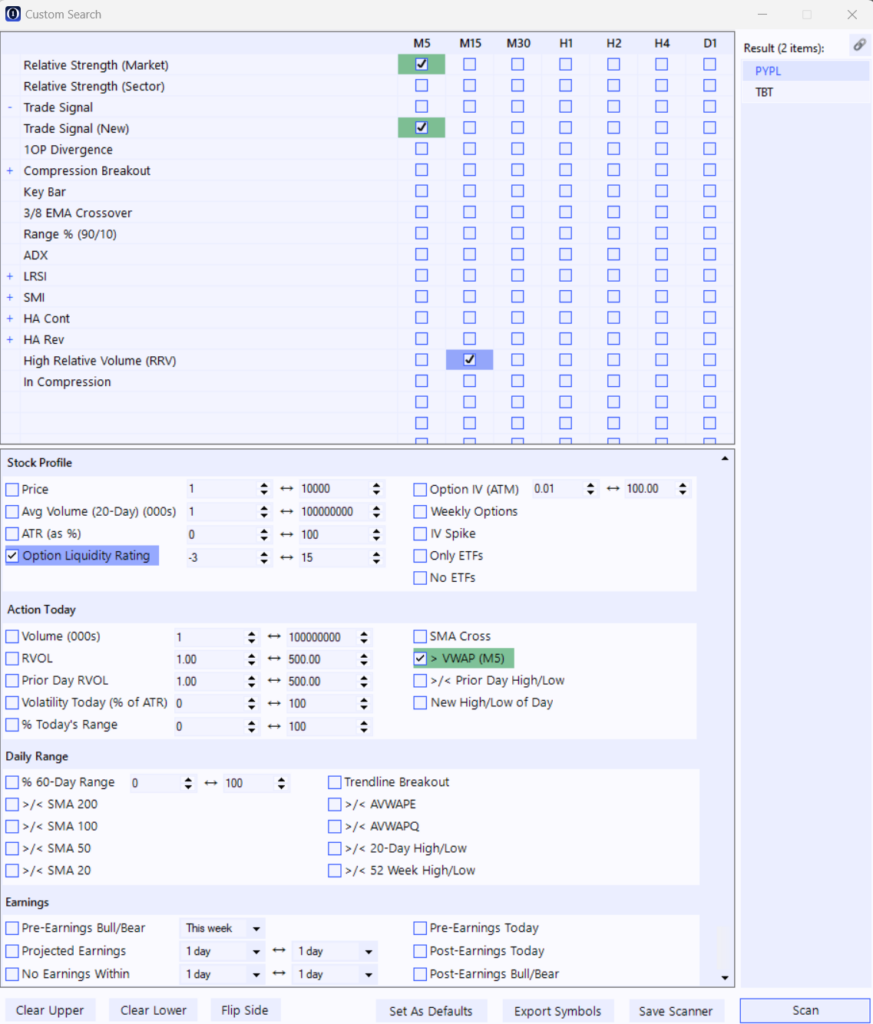
We will get into Custom Searches a little later, but here is a bearish search that I like to use for day trading. I also included the chart.
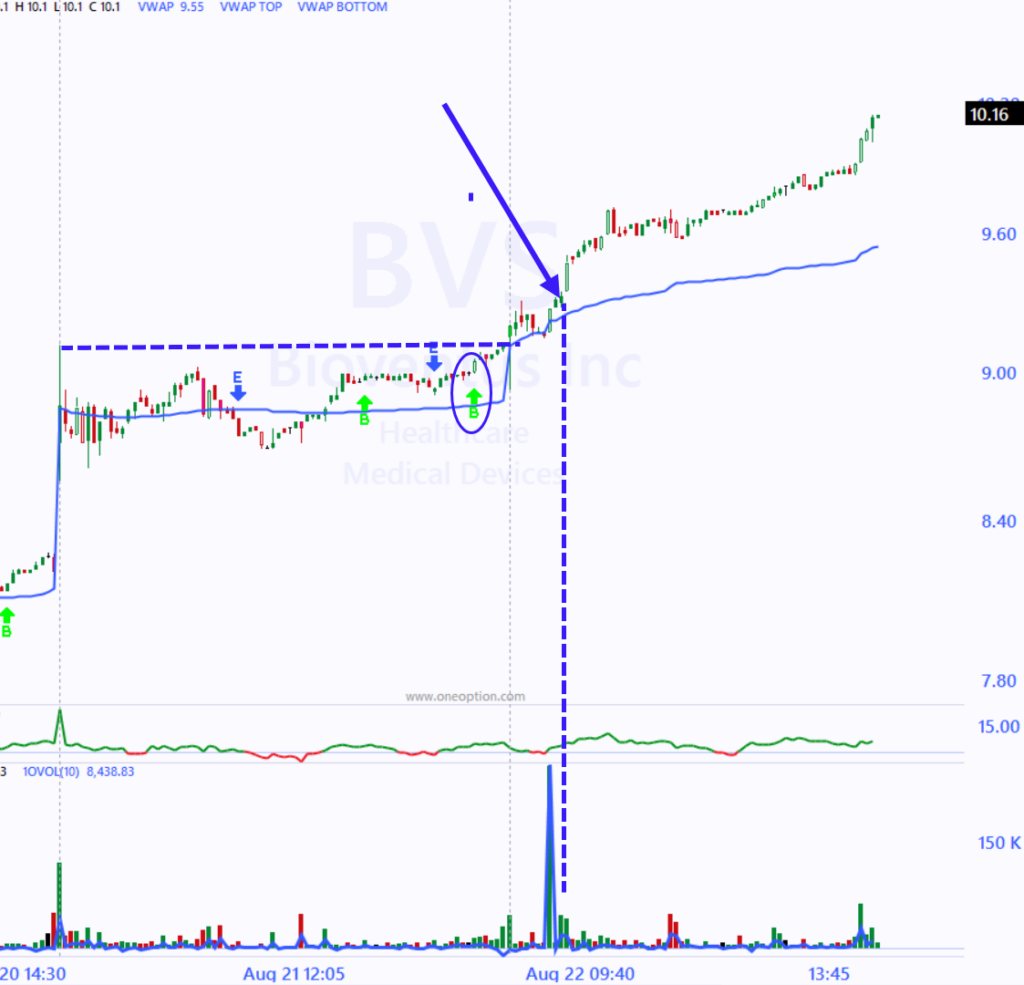
Here is the bullish counter part for that same search along with a chart for a candidate that came up. In Custom Search I used the Flip feature.
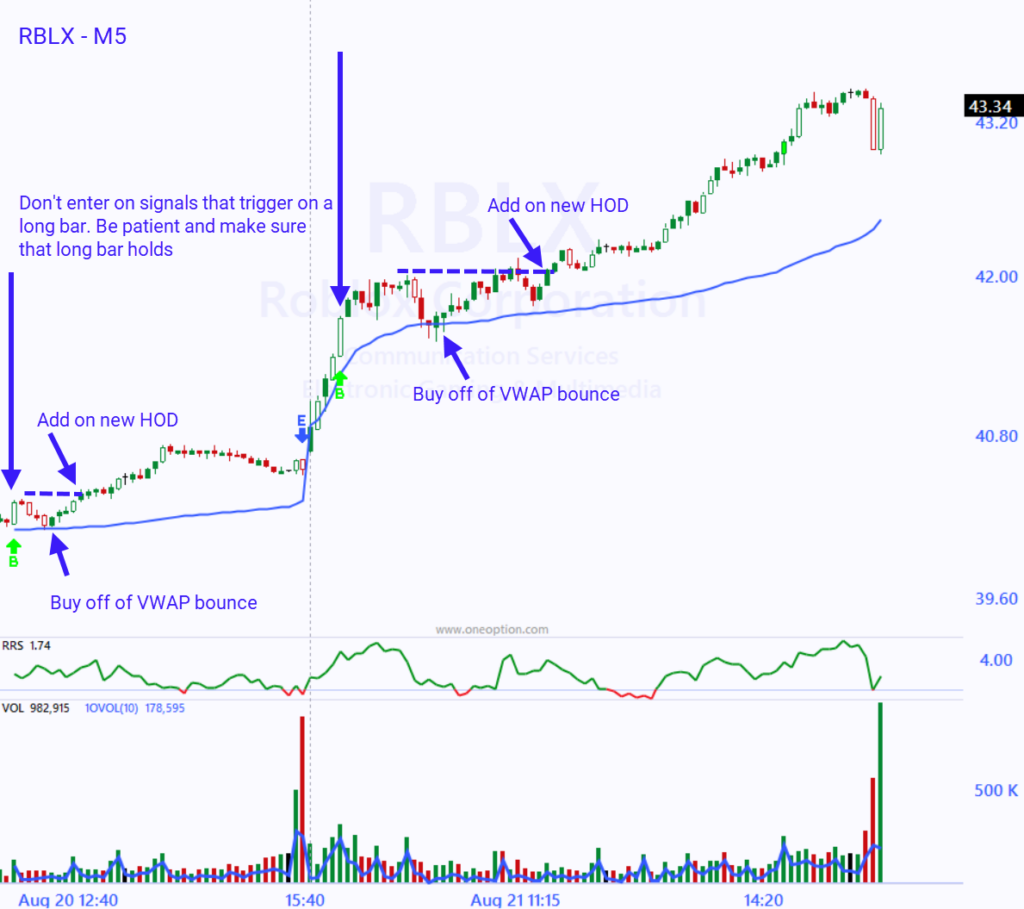
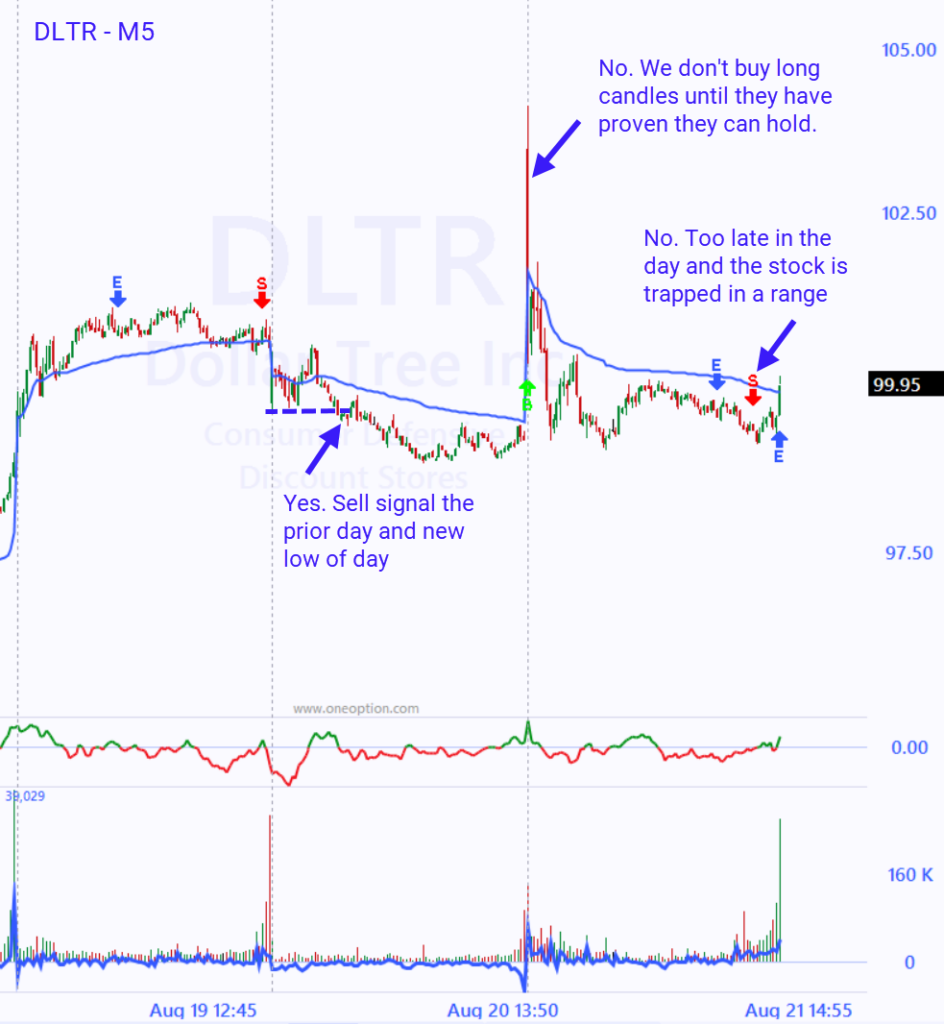
You should not enter new trade signals that are triggered on a long candle. That’s what “FOMO Joe” does. Be patient and wait to see how well that long bar holds up. At some point, the stock will retrace. When it does, we want to see a brief shallow dip that quickly runs its course. VWAP should be preserved and we want the open from that long bar to be preserved. This lesson has been taught in The System. It applies to all time frames and the lesson is worth repeating.
We’ve talked about the characteristics we like to see in a stock earlier in this course so this should be familiar to you. If the stock is directionless and it is trapped in a range…don’t trade it. Stocks that are in compressions or that have mixed overlapping random candles will produce false trade signals regardless of which indicators you use. You should avoid them. In the chart below, the stock had a buy signal the prior day and it broke out of the compression the next day. It tested the bid and VWAP held. That is where you would enter. Then it took out the high of the day (HOD). That is where you would add.
Here are some trades that you would not take based on some of the reasons we have already covered. Again, most of this is common sense.
Timeliness
One thing you will notice about the trade signals is that they are very timely. That means that if you catch them early, the stock will move in the desired direction and it will provide you with instant cushion. Let’s say that you entered a buy signal. Once you have cushion, place a stop just above your entry price. In doing so, you will not lose money on the trade and you will have plenty of upside. Keep your losses small and let your winners run. Isn’t that what we are striving for? Some of the trades won’t produce, but in some cases you will nail really big moves. I took a screen shot to illustrate this point on a choppy stock. There’s not a single trade worth considering in the chart below because the stock is range bound. With that in mind, you can see that the trade signals were timely and they provided you with instant cushion. Place the stop at your entry price once you have that cushion and manage profits. We are NOT looking for sloppy stocks like this, but I wanted to prove a point.
Using Multiple Time Frames
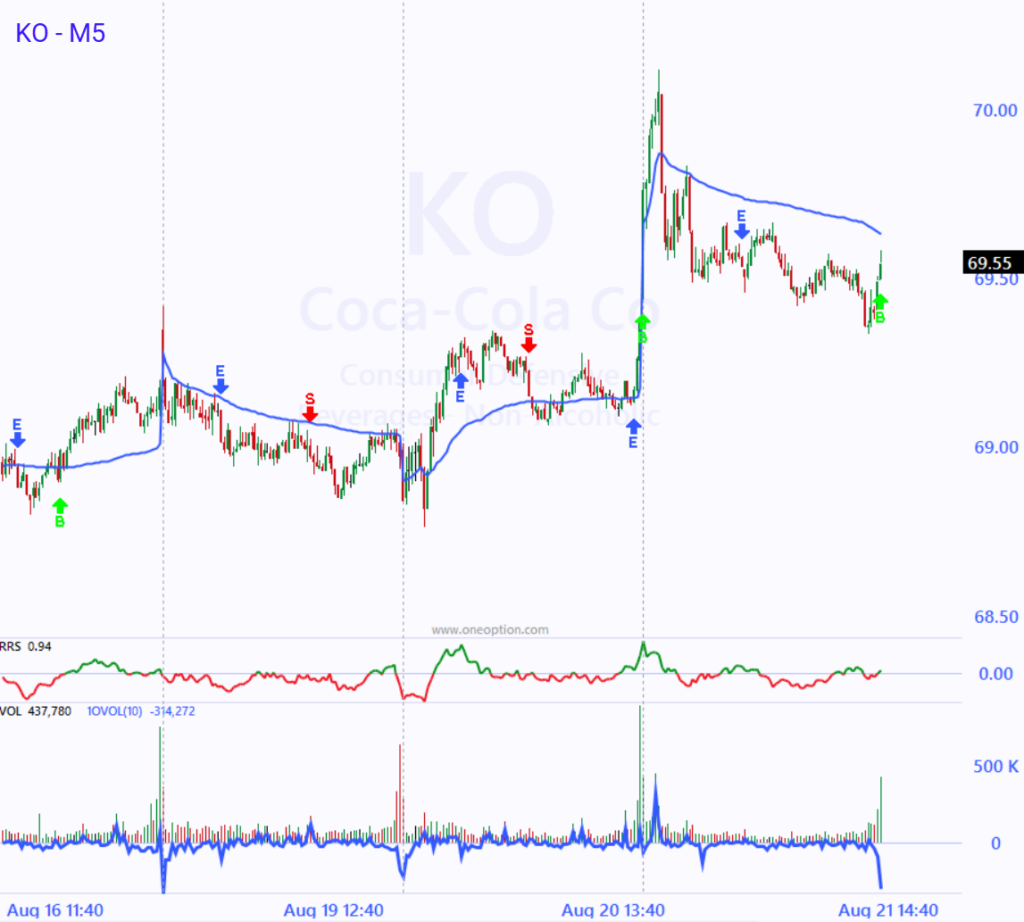
One of the most common mistakes traders make is that they don’t let their winners run. They leave a lot of money on the table and they are too quick to exit. If you are short-term swing trading on an M30 basis, consider using a shorter (more sensitive) time frame like M15 to exit the position. Knowing that those M15 exit signals are not going to let big profits slip away will give you the confidence to hold the position much longer than you might have otherwise. If you are a swing trader using D1 as your basis you might consider exiting based on the H1 signals especially when you have a runner. I know it’s hard not to take profits when they are huge, but you need to have big winners and you need to let them run. In the chart below it would have been tempting to take gains on any of the gaps down and that’s what most of us would do, but the stock fell much further. Set an alert based on an H1 buy signal and stick with the position until then. This will also help you manage your emotions.

Columns
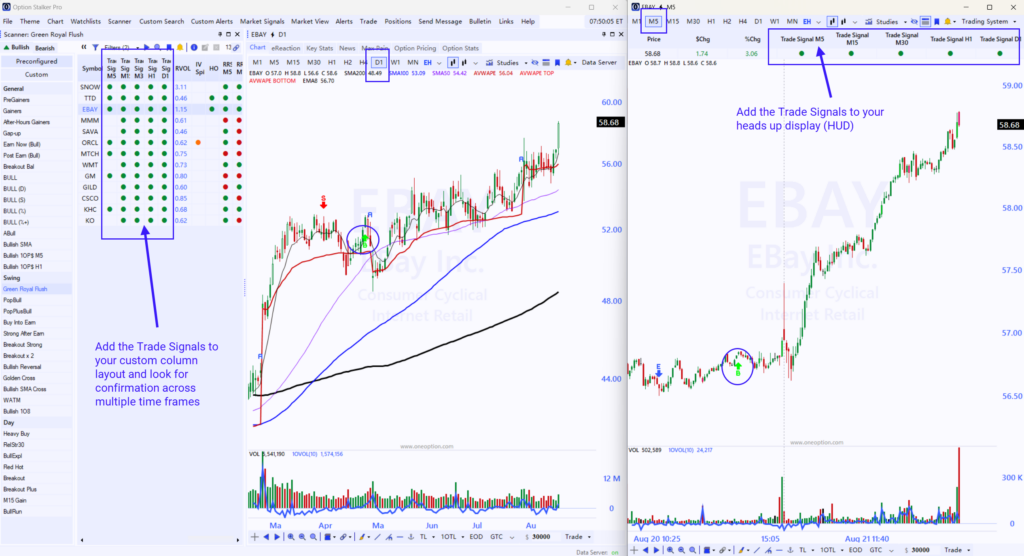
Add the Trade Signals to your Custom Columns for stock searches and watchlists. This is so incredibly efficient. The searches are powerful so these stocks are attractive. By adding the M5, M15, M30, H1 and D1 Trade Signals you will instantly spot the best prospects because the Trade Signals will be in agreement across multiple time frames. If the column is blank, it means the stock is currently neutral for that time period. You can also add the Trade Signals to the HUD (heads up display) so that they appear at the top of the chart.
Technical Breakouts
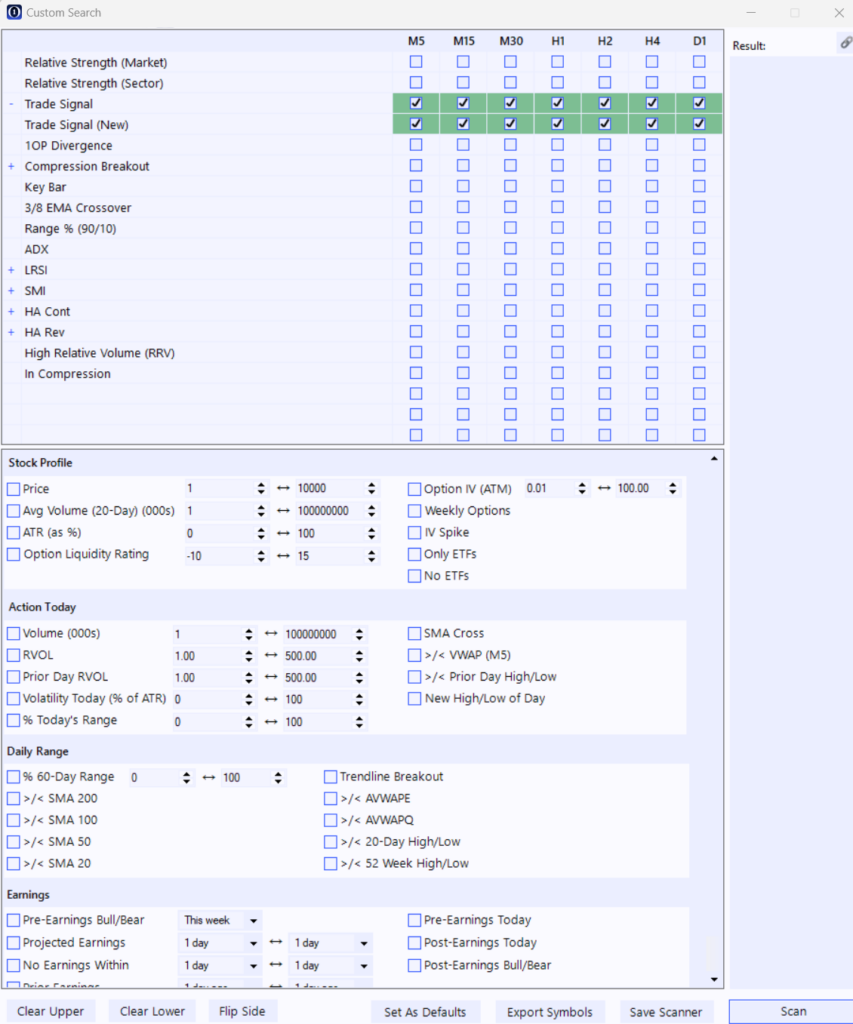
Earlier in this article I mentioned that the Trade Signals that coincide with technical breakouts are the most reliable. You can search for stocks that are on a buy or a sell signal across any time frame. Combine the trade signal with heavy volume, trendline breakouts, compression breakouts, SMA crosses or any of the other variables. The combinations are limitless. I also mentioned that the Trade Signals tend to produce immediate moves. Select Trade Signal (New) and you’ll know that it was triggered during the prior period or the one before that. As a day trader if the market is drifting lower you would want to find a stock that has a new buy signal, has heavy volume M15, good option liquidity, relative strength M5 and that is above VWAP. Why? That new buy signal tells you the stock is moving higher in a weak market. Those variables are all desirable and as soon as the market finds support the stock will lift off. You don’t have to buy these stocks, set alert lines and you’ll know when its time to enter. There are many combinations and this is only one example.
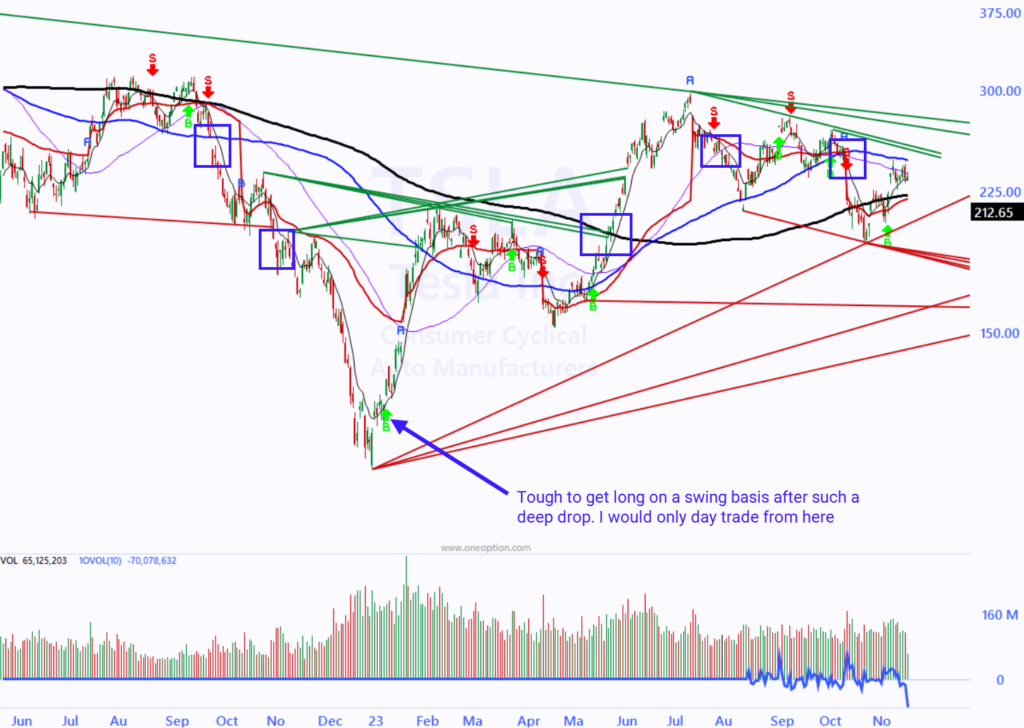
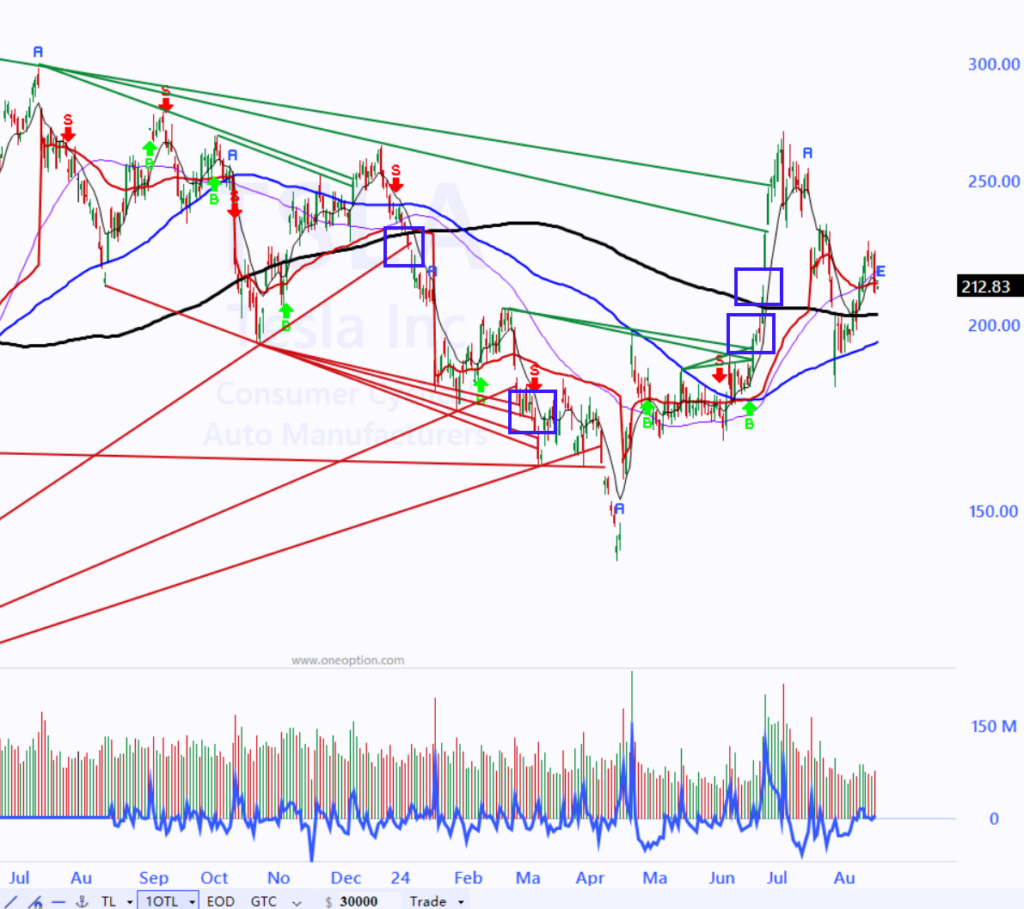
Here are a few D1 charts for TSLA. You can see the automated trendlines, the SMAs, AVWAPE, heavy volume and horizontal support and resistance levels that can be used in conjunction with the new Trade Signals. We can search for these set-ups using Custom Search and nail these “sweet spots”. I highlighted some of them using blue boxes.
Alerts
Alerts are incredibly effective and we have them available for the Trade Signals. It costs you nothing to set alerts. You have no emotional attachment like you do when you put a trade on and they don’t tie up your capital. When key technical events happen, you’ll see the alert trigger in the Alert Console. We have alerts for Trade Signals across all time frames. You can set alerts for all of the stocks in a search very easily. Just right click on the column header and it will add every stock in the search. Then select the alert variable and the time frame. This is a fast and effective way to be notified when there is a new Trade Signal for one of those stocks. Here’s an important note. In the screen shot below you can see that some of the stocks are neutral on an M5 basis (blank). If you set an alert for a Buy Signal M5, you will get an alert fairly soon for these stocks because the stock is just waiting for the buy signal to trigger. If the stock is on a sell signal (red dot), it is likely to have an exit signal and then a buy signal. You could be waiting for a while for this to trigger. Stocks that are already on a buy signal will need to go to an Exit signal and then back to a buy signal. Our servers know the current status of the variables and they know the status needs to change before an alert is triggered. For individual stock alerts, you can right click on a chart and set the alerts by selecting Create Alert in the pop-up. The alerts are going to do all of the heavy lifting for you and they will monitor the stocks. Sit back and wait for the trades to be delivered to you on a “silver platter”. Here’s how to set them for all of the stocks in a search.
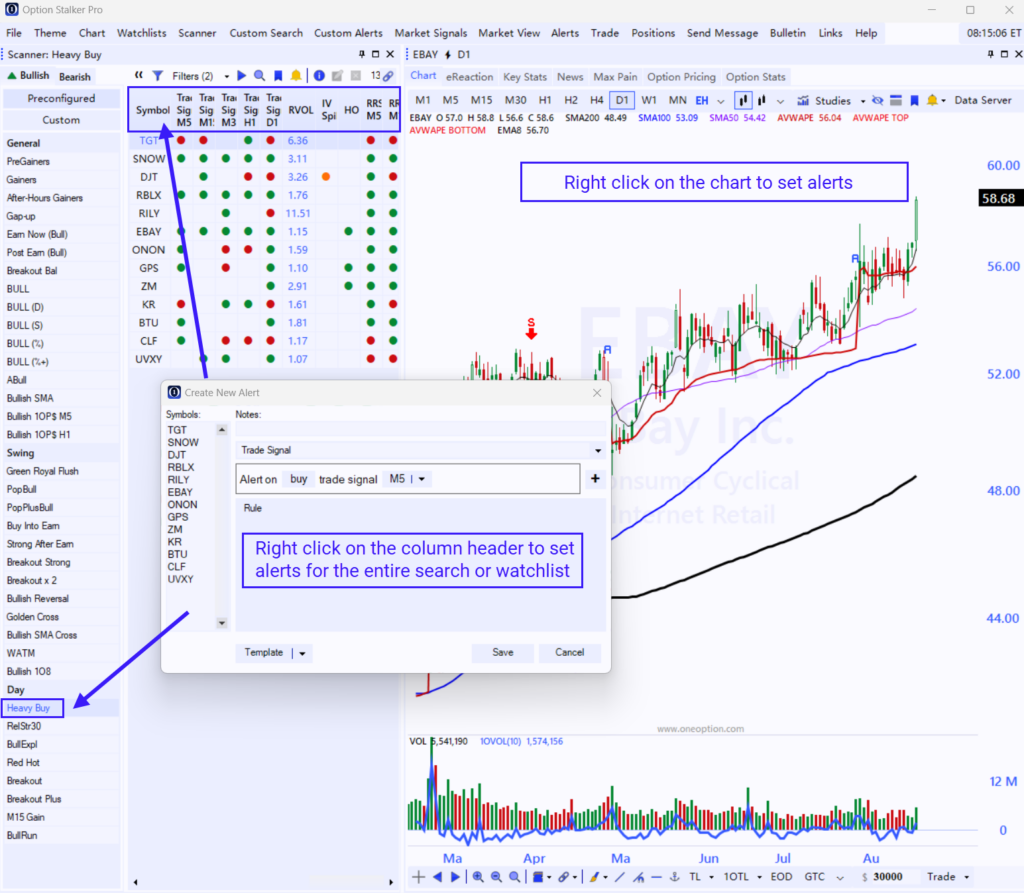
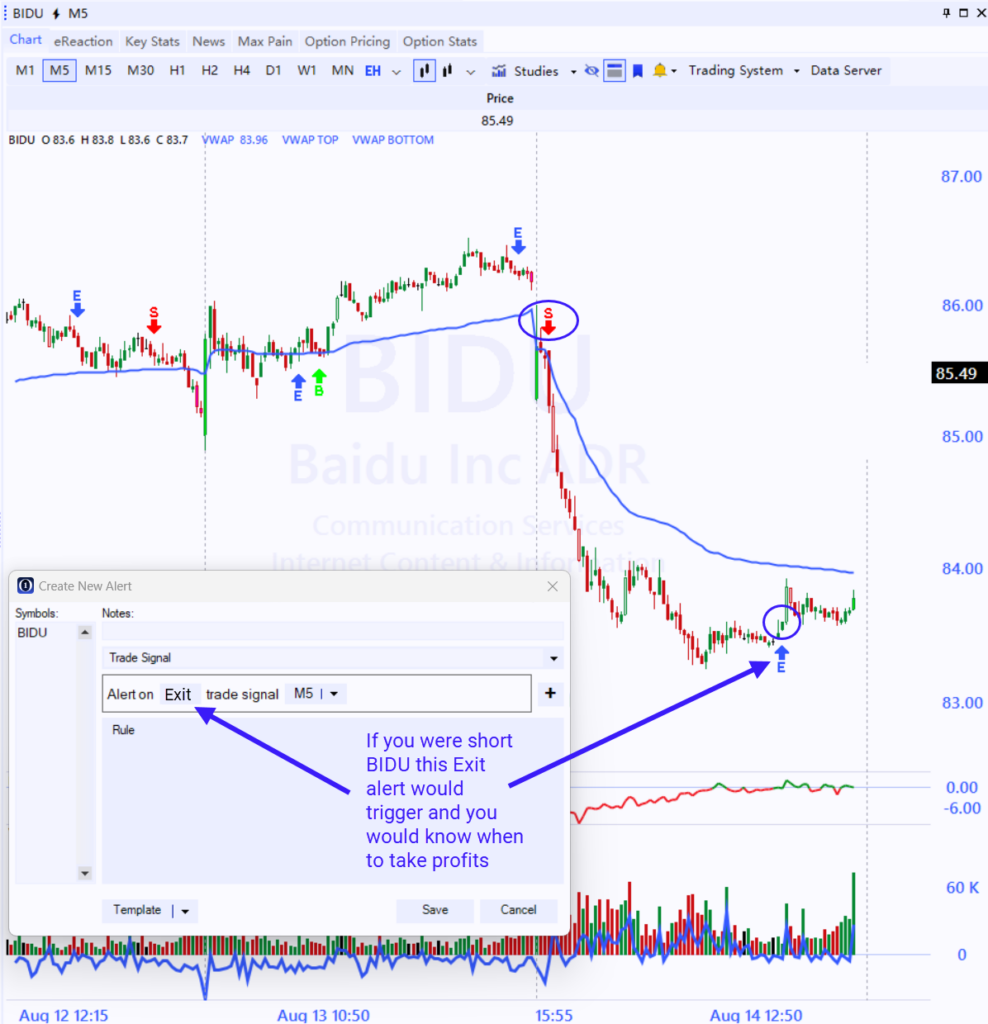
If you have a position, you will want to set a Trade Signal Exit alert (blue arrow) for the time frame you are using. This feature will help you manage positions and it is particularly effective when you have a big winner and when you want to lock in gains. You will get the alert if there is an exit.
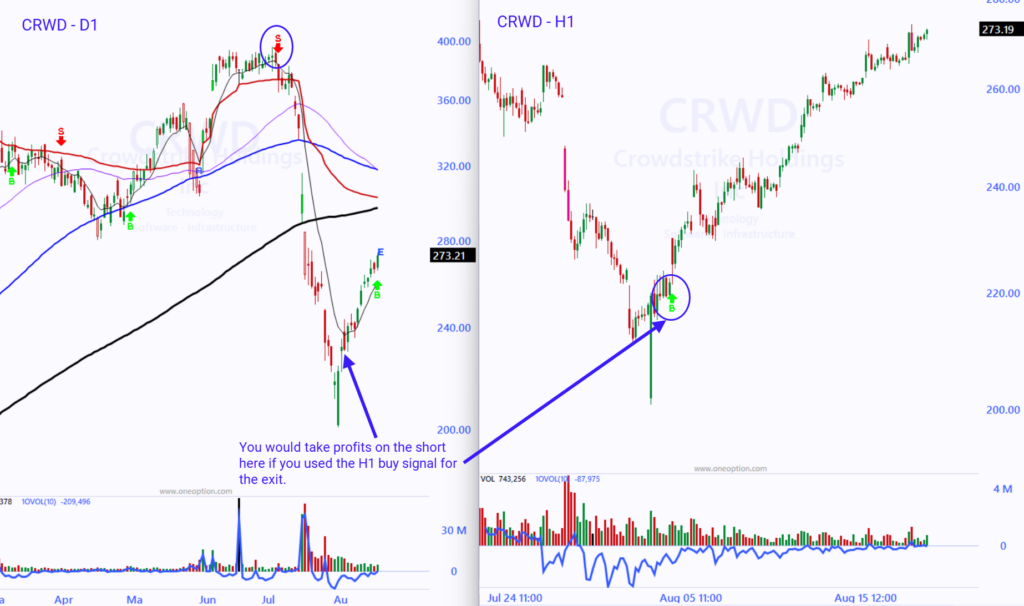
You can also select a contra alert (buy or sell signal). For example, if you are short a stock, you can set an alert based on a buy signal (and not an exit signal). The issue with using this method (contra signals) is that the signal is not as sensitive and you might wait too long before taking profits. If you are going to use contra signals, I suggest using a shorter time frame for the alert. I provided this example earlier where we were swing trading D1 and exiting based on H1 contra signals. Remember, the D1 time frame does not have exits, it pivots from buy to sell or sell to buy. In the chart below you can see how the D1 contra signal (buy) for CRWD came when the stock was $50 higher. That is why we suggest using a shorter time frame for contra exit alerts.
Both methods for setting alerts work well. Set an exit alert for the same time frame or use a contra alert using a shorter time frame. Since we do not offer M1 Trade Signals, it stands to reason that you would always use an exit alert when you are day trading on an M5 basis.
Option Stalker (web)
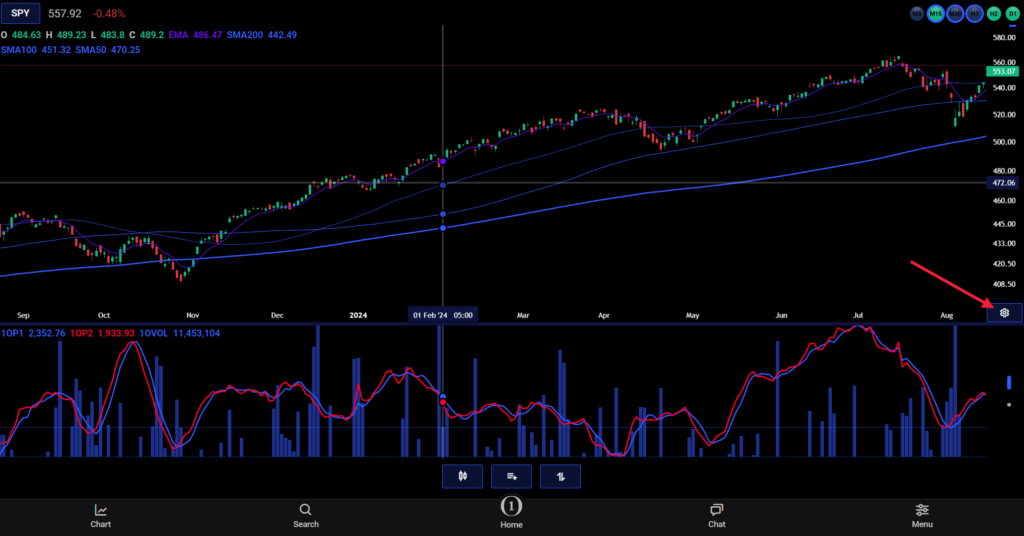
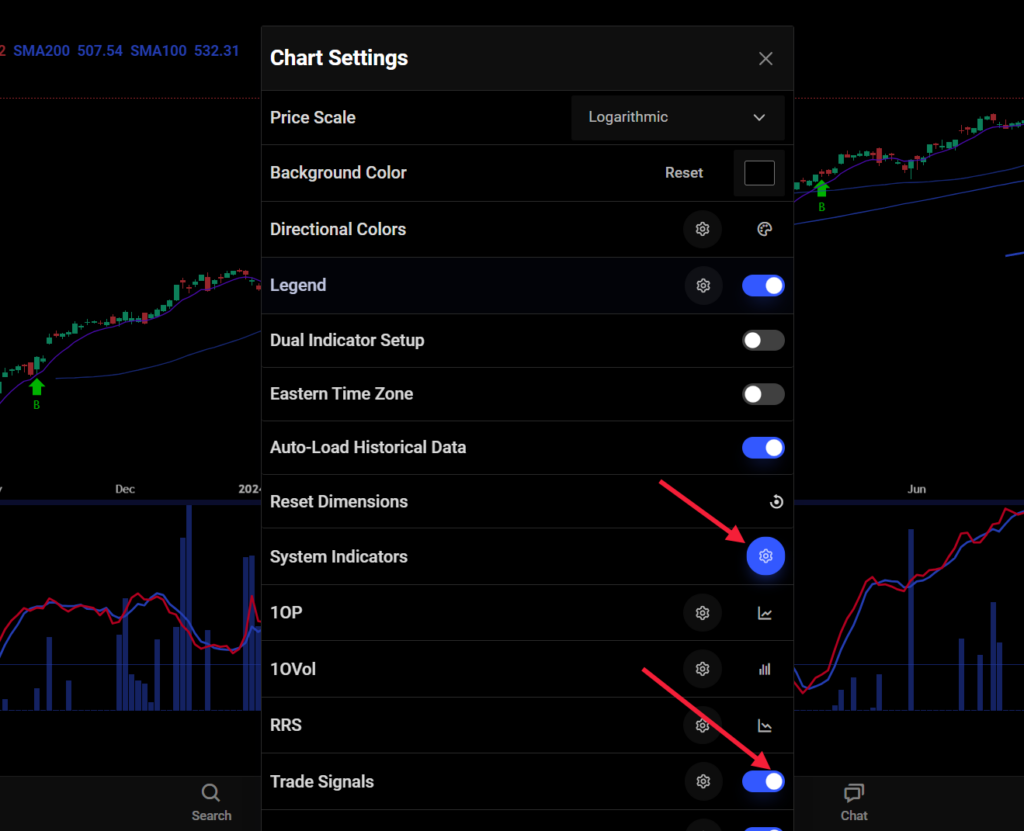
We also offer the Trade Signals in Option Stalker (web based software). It does not have all of the features offered in Option Stalker Pro, but you can see the Trade Signal status by looking at the green and red circles across multiple time frames in the software. If the Trade Signal is neutral, it will be gray. Here’s how to add the Trade Signal arrows to your charts. First find the gear icon in the price axis to the right when you have the charts displayed. Click it and find System Indicators in the menu. Once you select that you will see Trade Signals listed. Turn them on and you will see the arrows on the chart.
Conclusion
The Trade Signals are not the “Holly Grail” of trading. You should not expect that you can blindly follow them and make a fortune. They are very accurate, but your trading skills will play an important role in your success. Over time, you will gain confidence in them and they will become your primary trade consideration. You will also find new ways to use them in conjunction with other technical indicators. When the trade signals agree across multiple time frames, the signal is stronger. When the trade signals are accompanied by a technical breakout through a key price level, your odds of success will increase. You can add the Trade Signals to your searches and watchlists using the Custom Columns in Option Stalker Pro. This will allow you to quickly identify the best prospects at a glance. You can add the Trade Signals to your charts using the HUD (heads up display) and by adding the arrows to the charts. You can add the Trade Signals as a variable in your Custom Searches and you can set alerts for them. I believe they will improve your confidence and they will help you enter and exit positions more effectively.
This has been a very long-term project and I’m excited to get this powerful tool in your hands.