Day trading from a mobile app can be challenging due to display limitations. Multiple chart configurations are not possible so an efficient user interface is critically important. Option Stalker delivers the best prospects through its powerful searches and it reveals the trade signals for the market and the stock across multiple time frames on a single screen. When the signals agree across multiple time frames you know instantly that the wind is at your back. The charts display the buy/sell arrows along with our proprietary indicators and changing time frames is as easy as clicking that dot.
We suggest waiting for all of the SPY trade signals to be in agreement across all time frames. This will provide the best backdrop for a trade. The exception is the M5 time frame. For example, let’s say that all of the other time frames for SPY are green except for M5. When M5 turns green you would look for stocks that have green signals across all time frames. You also want to see that the stock remained strong during the market dip. If the 1OSI indicator stayed above zero on the M5 chart you will know that it is strong relative to the SPY. That brief market pullback provided a nice entry point for your trade. You would stay in that day trade until the stock’s M5 arrow changes or until the SPY M5 arrow changes. There are hundreds of strategies you can use. The “trend is your friend” and the tiny pauses (red M5 arrow) provide you with an opportunity to join it.
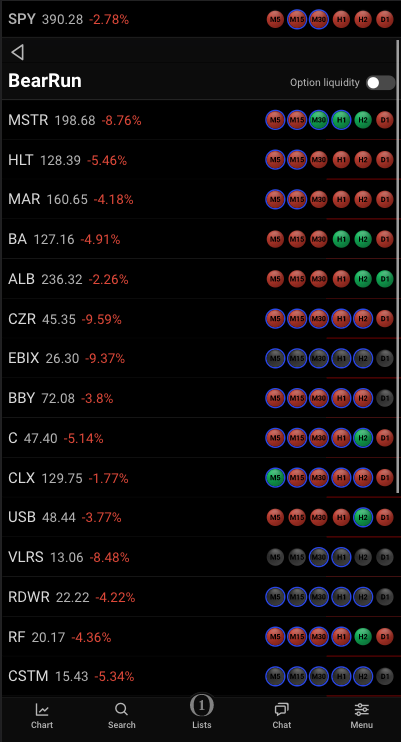
A Royal Flush for the SPY and a matching Royal Flush for the stock will yield the best results for day trades and swing trades.
Adding the chat room subscription would help tremendously. Full-time day traders with multi-monitor displays will be posting their stock trades and their commentary.
Quick tips for first-time Option Stalker users
1. Find the SPY signals across the top. You want solid colors. Green is bullish and red is bearish.
2. Find three horizontal dots in the upper right-hand corner – click them. Select the searches that match the SPY. If the SPY signals are green, select Day Bull. These are the bullish searches for day traders.
3. Select Bull Run or another search and view the results.
4. If you see a stock that has solid green colors, you can click on any dot to view the chart for that time frame. The chart includes our indicators and buy/sell arrows.