Introduction
The bearish flag pattern in candlestick charting is an advanced indicator that forecasts the continuation of a downward market trend following a temporary cessation. This continuation pattern enables sellers to exert further downward pressure on market prices.
During a pronounced downtrend, market prices typically consolidate within two parallel trend lines, moving counter to the prevailing downtrend. The activation of the bearish flag pattern occurs when the lower support trend line is breached, indicating a resumption of the downward price movement.
This article delves into the intricacies of the bearish flag pattern, exploring its structure, inherent strengths, and potential weaknesses. Additionally, we present a sophisticated trading strategy to leverage this pattern for financial gain.
Table of Contents
Understanding the Bearish Flag Structure
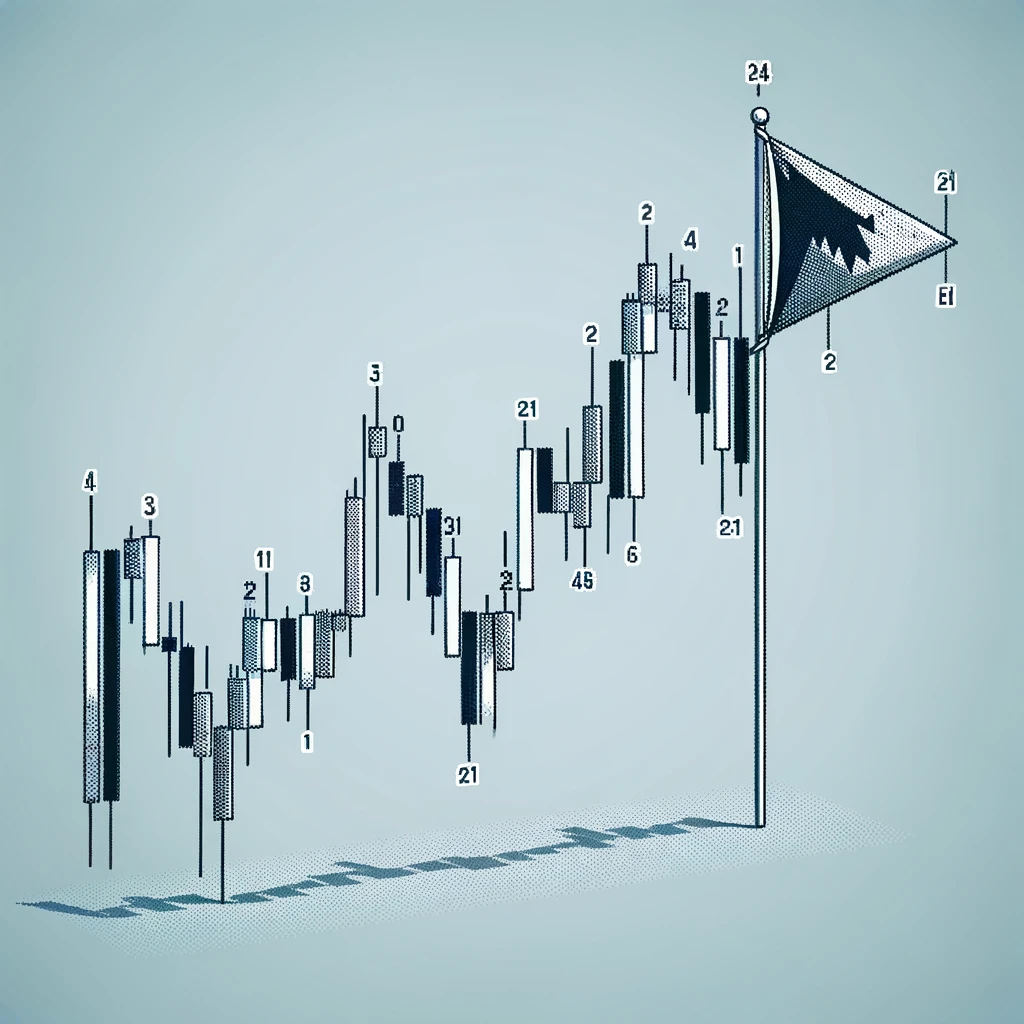
Similar to its bullish counterpart, the bearish flag comprises two elements: the flagpole and the flag. The flagpole forms as the market experiences a downward trend, characterized by successive lower highs and lower lows.
Upon establishing a new low, a temporary rebound occurs as sellers temporarily lessen their market pressure. This rebound occurs within a parallel channel, which contrasts with the wedge or triangular formation observed in bearish flag patterns.
During this rebound phase, buyers attempt to diminish the sellers’ momentum, who maintain control of market trends. Conversely, the sellers utilize this phase to consolidate recent gains and prepare for a subsequent downward market push.
The consolidation should not be excessively extensive. The extent of the rebound is often dictated by the strength of the original downtrend and generally should not surpass the 50% Fibonacci retracement level of the flagpole. Ideally, a pullback should conclude around the 38.2% Fibonacci level, indicating a robust downtrend and a likely forceful breakout.
Key Elements of the Bearish Flag Pattern
- The Flagpole: This is observed when an asset’s price exhibits a continuous downtrend, marked by successive higher highs and lower lows.
- The Flag: A consolidation phase between two parallel trend lines moving in an uptrend.
- The Breakout: The breach of the support trend line signals the commencement of the bearish flag pattern.
Interested In Learning More?
Strengths and Limitations
The bearish flag, as a continuation pattern, aids in extending downward market trends. It provides traders with a tool to identify the current phase of a market downtrend and signals the end of a consolidation phase as selling pressure mounts. The pattern offers well-defined levels for market entry, as exemplified later in this article.
Regarded as a robust technical pattern, especially when the retracement concludes around the 38.2% level, the bearish flag’s primary advantage lies in its ability to offer an attractive risk-reward ratio with clearly defined levels.
However, a prolonged or erratic consolidation phase may lead to a trend reversal, diminishing seller momentum and bolstering buyer confidence. Hence, it’s prudent to avoid trading flags with extended, choppy consolidation phases or those that exceed a 50% retracement.
Identifying the Bearish Flag Pattern
To spot a bearish flag, one must first identify a prevailing downtrend. The rebound should occur within an ascending channel, and the extent of the correction needs monitoring.
For instance, in the EUR/USD currency pair, an aggressive downtrend was followed by a brief and moderate rebound. However, the market prices consolidated within two parallel lines before the sellers regained control, not even reaching the initial 23.6% Fibonacci retracement level.
Trading the Bearish Flag Pattern
The approach to trading a bearish flag mirrors the strategies employed for other candlestick patterns. Once the flag is identified, patience is required to await a potential support line breach.
Premature market entry is a common pitfall among traders, leading to suboptimal outcomes. The pattern becomes actionable only after a confirmed breakout.
In our example, two standard entry options are presented post-breakout: immediate trade initiation upon the closing of the breakout candle below the flag, or awaiting a throwback, where the market price retests the breached channel. The latter offers a more favorable risk-reward ratio, while the former ensures participation in the trade without relying on a potential throwback.
In our scenario, we opted for immediate trade initiation after the breakout candle closed decisively below the lower trend line. The stop loss was set approximately 20 dollars above the entry point, within the channel. A similar principle to the bull flag applies: a move back into the flag invalidates the pattern.
The take-profit level is determined by measuring the flagpole’s length and projecting it from the breakout point. Ultimately, our strategy yielded a gain of approximately 85 dollars, compared to a risk of 20 dollars, demonstrating an attractive risk-reward ratio. Had we chosen the second entry option, our gain would have increased by an additional 5 dollars with a correspondingly reduced risk.
Conclusion: Harnessing the Power of the Bearish Flag for Market Insight
In summary, the bearish flag pattern stands as a powerful tool in the arsenal of technical traders, offering a strategic advantage in identifying and capitalizing on continuing downtrends. Its structured approach, marked by the distinct phases of flagpole formation and consolidation, provides a clear framework for market entry and exit decisions. The pattern’s ability to signal the exhaustion of a counter-trend rebound and the resumption of the dominant downtrend is invaluable for traders aiming to optimize their market positioning.
However, it’s essential to approach the bearish flag with a discerning eye, recognizing that its reliability hinges on the context of the broader market trend and the nuances of price action. Traders should integrate this pattern into a holistic trading strategy, considering other technical indicators and market dynamics to mitigate risks. By doing so, the bearish flag becomes not just a pattern of prediction, but a lens through which market psychology and momentum can be understood, offering traders a deeper insight into the ebbs and flows of market trends. Ultimately, mastery of the bearish flag pattern equips traders with a refined ability to navigate the complex and often unpredictable financial markets, turning bear trends into opportunities for strategic gains.
Disclaimer
The opinions, news, research, analyses, prices, or other information contained in this article are provided as general market commentary and do not constitute investment advice. OneOption assumes no liability for any loss or damage, including but not limited to profit loss, arising directly or indirectly from the use or reliance on such information.

Interested In Learning More?
Part 2: The Bearish Flag and Price Action: Interpreting Market Movements with Precision
In our exploration of the bearish flag as a technical indicator for market downtrends, it’s pivotal to understand the underlying concept of price action trading. This approach, akin to discerning the landscape beyond the confines of a map, involves a direct analysis of price movements over time, often with minimal reliance on technical indicators.
Price action trading focuses on trends, chart patterns, and significant historical price events and movements. It’s an approach that eschews the clutter of numerous indicators for a more streamlined analysis, allowing traders to work directly with an asset’s price and its historical trajectory. This method offers a clear, unobstructed view of the market’s pulse, facilitating an insightful anticipation of potential directional shifts.
Delving into Price Action Trading
Price action trading is an analytical method that derives its insights solely from the study of price movements. This approach often involves the use of charts stripped of all but the most essential indicators, like volume, to focus purely on price. Such an unadorned approach might seem simplistic at first glance, but it can reveal subtle market dynamics that might be obscured by the use of multiple indicators.
Price movements, from minor fluctuations to significant gaps, are akin to William Blake’s “world in a grain of sand.” They offer a microcosm of market sentiment and potential future trends.
Rationale Behind Minimizing Indicators
While indicators have their place in emphasizing certain aspects of the markets, they can inadvertently create blind spots by obscuring other crucial details. Traders often find themselves juggling multiple indicators to fill these gaps, which can lead to conflicting signals and the paralysis of over-analysis. The essence of price action trading lies in its focus on the immediate, unfiltered behavior of the market, free from the lag and bias of indicators.
Analyzing Price Action: A Three-Pronged Approach
Price action analysis typically concentrates on three main areas: trends, chart patterns, and significant technical events. Trends are identified by classic patterns of highs and lows; chart patterns encompass a wide range of formations from symmetrical triangles to candlestick patterns; and technical events are crucial junctures in price movements that serve as historical reference points for future trading strategies.
Understanding Price Floors and Ceilings
Grasping the concepts of support and resistance is crucial in price action trading. These are the levels at which the market repeatedly stalls or reverses, offering valuable insights into the underlying market dynamics.
Advantages and Limitations of Price Action Trading
Price action trading offers a streamlined, direct perspective on market trends, free from the clutter and bias of excessive indicators. However, like any analytical approach, it is subjective and open to interpretation. Two traders might perceive the same price action differently, much as they might interpret indicator data in varied ways.
Concluding Thoughts
Price action analysis, like all technical trading methods, is a fusion of art and science. It’s not universally suitable but aligns well with traders who prefer a direct, unencumbered view of market dynamics. Traders might also consider a hybrid approach, combining the clarity of price action with selective use of technical or fundamental indicators. Ultimately, reading the charts remains a nuanced blend of analytical rigor and interpretive skill, perfectly complementing the intricate understanding of patterns like the bearish flag.


