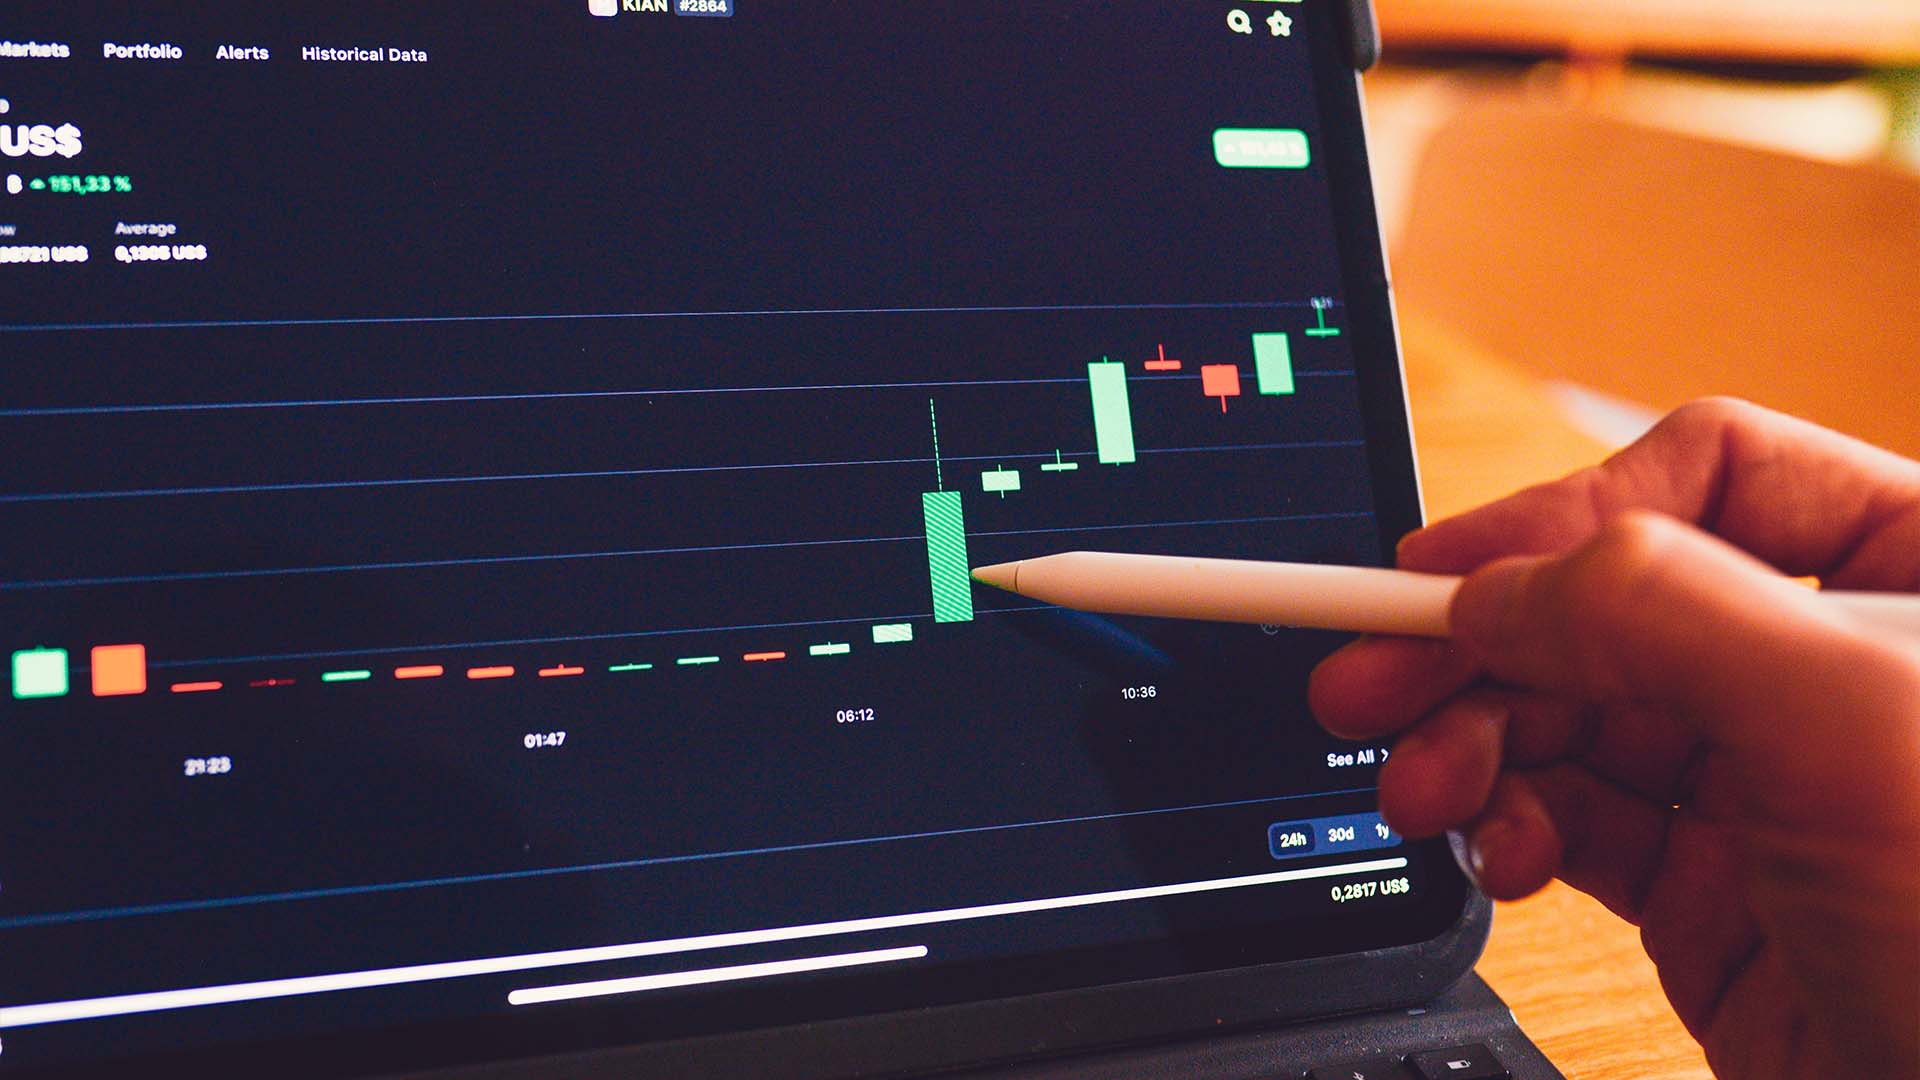
In today’s option trading blog I will discuss why I rely heavily on fundamental analysis in the latter stages of my research. I don’t start with fundamentals because I don’t want to wait around for five years while market figures out that AAPL is a good stock. That company was sitting at $15 with a pile of cash for years. Once it broke out in 2004, it was time to consider it. That pretty much explains why I start my research with technical analysis. I want to make sure the stock is on the move so that I can make my money and get out. After all, as an individual, that is my edge. Large firms can’t be in and out of a stock so they rely heavily on fundamental analysis. They tour the company and attend shareholder meetings knowing that they’re in for the long haul. I start my technical analysis by programming long-term indicators into proprietary searches. Without getting too specific, having a a 200-Day moving average that is higher today than it was 20 days ago is of interest if I’m looking for a bullish stock. Having an ADX that is over 35 and rising is also of interest. Finding a stock where the 20 day average daily volume is higher today than it was 10 days ago is also of interest. These are a few examples of the technical analysis that is built into my research before I even look at a chart. Most of my studies are based on relative value (where the indicator is now, relative to where it was a month or two ago). This filters out the vast majority of stocks on macro basis. As my analysis zooms in on the present, my searches target four basic set-ups I like to trade. On average, about 300 stocks make the list on a daily basis (bullish and bearish). I trade break-outs/break-downs, gaps, trends and greenlines/redlines. These set-ups represent recent price action. A break-out/break-down is a 10-day high/low. A gap up is defined as stock with a low today that is greater than the prior day’s high (inverse for gap down). I like gaps so much that I even look at two and three day old gaps. A trend is defined as three or more consecutive closes in one direction. A greenline is defined as an open near the low (no gap) and a close near the high (inverse for redline). To recap, my proprietary searches start with macro indicators and end with the tail-end of the chart – the most recent price action. There is a dilemma that every programmer faces. Searches can be too open (valuable time wasted sifting through symbols) or they can be too restrictive (most good trades are eliminated). I have found an optimal balance. The majority of stocks are filtered out by my search engine and the final step of the process uses the most powerful tool I know – a trained eye. I have and interface that allows me to quickly flip through charts. If a chart looks good I zoom out to a one month view. If it still looks good, I zoom out to a 1-Year chart. When I perform visual technical analysis I look for nice tight price patterns. Once I have a handful of solid candidates that I really want to explore, I keep my tools pretty basic. I look at moving averages (20, 50, 100, 200), volume, trend lines and horizontal support/resistance levels. At this juncture I use the logic that if every other trader feels the level is important, so do I. If I can spot it so can they. If it is breaks, the event is significant because it will affect the demand/supply. I am not a big fan of Oscillators, Fibonacci Lines, Elliott Wave… It’s not that they don’t work, they don’t work for me. There are a gamut of other indicators. Some are leading and some lagging. I’m certain a case can be made for all of them. Once a stock is in front of me all I want to do is measure it’s relative strength/weakness to the market. I do that by watching it trade. This is not the right way, it’s just my way. You have to find what works for you. Once all of the technical analysis is done, I review the fundamentals of the company. This part of my research gives me “staying power”. I’m intimate with the company and I know what’s driving the stock. I also know if there are any news events on the horizon. The resulting “piece of mind” helps me take a little heat on the position without the fear that I’ve missed something. All of my trade ideas come from my searches. Want to check out six of my bullish proprietary searches? Click Here. You’re bound to see some good stocks. Please comment and share your “gems”.
How I Use Technical Analysis to Find Stocks!
Archives
June 21, 2006
5 min read


