This Is How I Plan To Swing Trade This Market Drop
Posted 9:30 AM ET – The warning signs were there and we were waiting for the market drop. The FOMC Minutes were a splash of cold water Wednesday and the market pulled back off of its high. Yesterday the market paused ahead of the jobs report and the reaction this morning has been slightly negative.
Analysts were expecting 479K jobs and 199K were created. I do not trust the government’s numbers because they are impacted by holidays, adjustments and local offices reporting correctly. ADP processes payroll checks and they have no agenda. They know how many checks they cut and they reported 807K jobs in the private sector. I do have one component of the jobs report that I track. Hourly wages went up .6% and that is high. This is the largest input cost for companies and it is inflationary. For that reason I view the number as bearish for the market. US 20-Year Treasuries (TLT) is dropping and it is close to a major technical support level at $141. If that is breached it will provide a stiff headwind for the market.
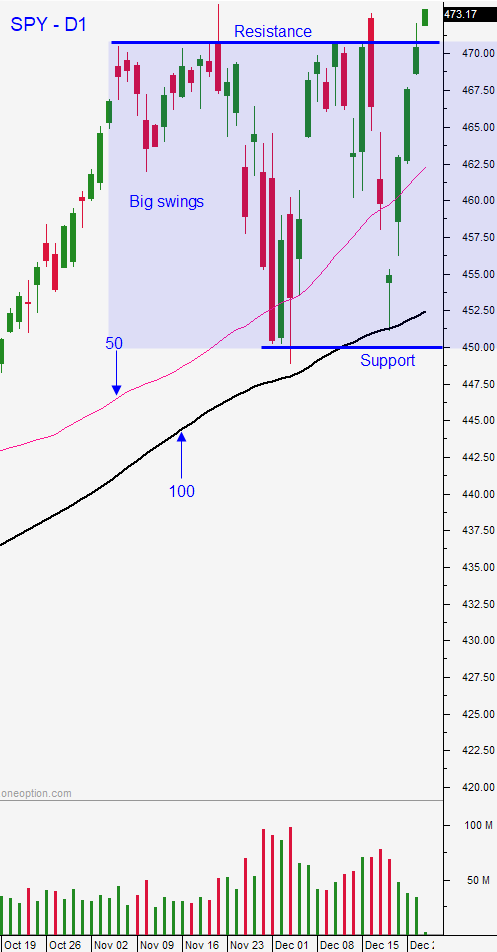
Swing traders, find stocks with relative strength. If the last price is in the upper right hand corner of the daily chart, it could be a good candidate. Lean on those major technical support levels and try to get 20-25% of your bullish put spreads on today if the 50-day MA holds. Keep the majority of your powder dry for the next leg lower and continue to wait for support to be confirmed. If the SPY tests the 100-day MA, it won’t be there long. A bounce off of that support level is where you can add the rest of your bullish put spreads. We want a bullish hammer on a daily chart or a bullish engulfing candle after testing the 100-day MA on SPY. Buyers are typically engaged ahead of earnings season and I am expecting the 100-day MA to hold for at least a few weeks.
CLICK HERE TO WATCH TODAY'S VIDEO
Day traders should watch the open. The reaction to the unemployment report has been mixed and yesterday we flat-lined in a tight range. My favorite scenario would be a small bounce on the open that loses its momentum in 30 minutes. Tiny bodied candles will be a sign of resistance and 1OP will start the day with a bullish cross from a deep trough. If the duration and magnitude of the opening bounce is meager, I will be looking to short the first bearish 1OP cross. I do NOT believe that Asset Managers are going to rush in and buy this dip yet. They need more proof of support and I feel that we will see more selling pressure in the next few days. If I see long green candles stacked consecutively with little overlap on the open, that will be a sign of strength. This scenario is unlikely (10%). Long red candles stacked early would be bearish and if we take out the 50-day MA with ease on the first attempt that would be bearish. I would still want to see what happens during the pending bullish cycle on 1OP. Let the price action unfold. In the last 8 trading days we have only had one day with a decent range. The rest have been very tight compressions with little to no direction. Be patient and wait for one or two windows to set up during the day.
In the next day or two we will have follow though selling. I do not believe that we will see a decent, sustained rally until that low is set and tested. Be patient.
Support is at the 50-day MA and resistance it at $471 and the all-time high.
.
.


Daily Bulletin Continues...

