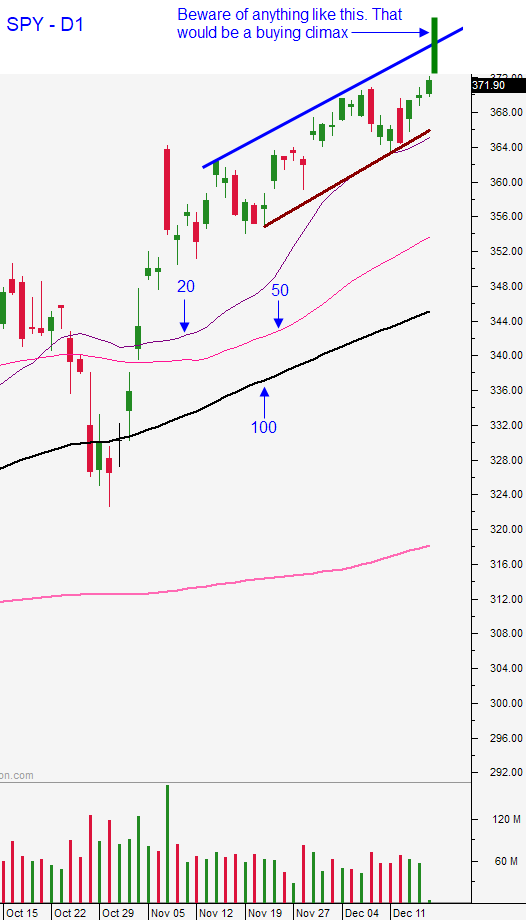
This Chart Pattern Will Signal the Top of the Market Rally – Watch For It
Posted 9:30 AM ET - Seasonal strength and the prospect of a scaled-down stimulus bill are fueling the market rally. Dovish comments from the Fed yesterday suggest economic uncertainty. Consequently, monetary policy will remain loose for at least another year. Stocks continue to grind higher and the S&P 500 is slated to open at a new all-time high this morning.
There isn't much overnight news to report. These same themes have been present for months and Asset Managers are banking on a vaccine related economic recovery in Q1. The virus is taking its toll on furloughed workers and small businesses while states shut down. We don't know how quickly the vaccines will be distributed or how widely accepted they will be. At this juncture, the most optimistic outcomes are priced in.
The S&P 500 is trading at a P/E of 40. Stocks are rich and we can expect pullbacks when the rally gets over-extended. Fear (as measured by option implied volatilities) is at historic lows. The last bar of the chart I posted today was drawn in. It would signal a buying climax and it will spark profit taking. Exit long positions and even consider some shorts if you see it.
There are two paths that the market can take in Q1. Stocks can continue to tread water and gradually float higher while profits catch up or the market can pull back to a lower level and spend time getting back to the all-time high. I believe the second scenario is more likely so caution should be used.
There are a couple of potential speed bumps. A hard landing for England is still very possible and that could be disruptive (currencies and commerce). The Senate runoff in Georgia will take place in a month and the Trump tax cuts are likely to be repealed if Democrats control Congress and the White House. Thirdly, the economic recovery could take longer than expected if the virus continues to spread and if vaccinations fall short of expectations. I'm not saying that any of these scenarios are likely, I am just pointing out that positive outcomes are priced into the market.
Swing traders should passively sell out of the money bullish put spreads on strong stocks that have NOT run hard. Stocks that have posted big gains are the most vulnerable to profit-taking. Avoid parabolic charts. By selling out of the money bullish put spreads we have cushion in the event that the market does retrace. Time decay is constantly working in our favor and we have the ability to assess market conditions when our spreads expire worthless. Our short strike price is below technical support and that also increases our probability of success. Last night I recorded my Weekly Swing Trading Video with four new bullish but spreads that fit this profile. We will need a little help from the market and from the stocks to get filled, but we are trading on our terms and we are not chasing.
Day traders should be cautious. Intraday ranges are collapsing and trading volume will continue to deteriorate into year-end. Trim your size and your trade count. Identify strong stocks with heavy volume and patiently wait for dips. Buy these pullbacks and set passive targets. Do not buy breakouts since most of them fail. Realize that you don't have much of a market tailwind and that your gains per trade will be smaller. It's time for a hit-and-run strategy where you adopt a scalping mentality. If you have a particularly strong set up, consider carrying if you overnight logs. You don't have to worry too much about having the rug pulled out from underneath you (big market drop) into year-end and some of your biggest gains will come overnight. By trading relative strength these stocks will hold up better than the overall market if there is an overnight market decline.
Support is at SPY $367.50 and resistance is at the all-time high. I believe that the next resistance level is at SPY $377. This is a low probability trading environment so keep your bets small.
.
.


Daily Bulletin Continues...

