Big Market Breakout Pending – These Are the Key Levels To Watch
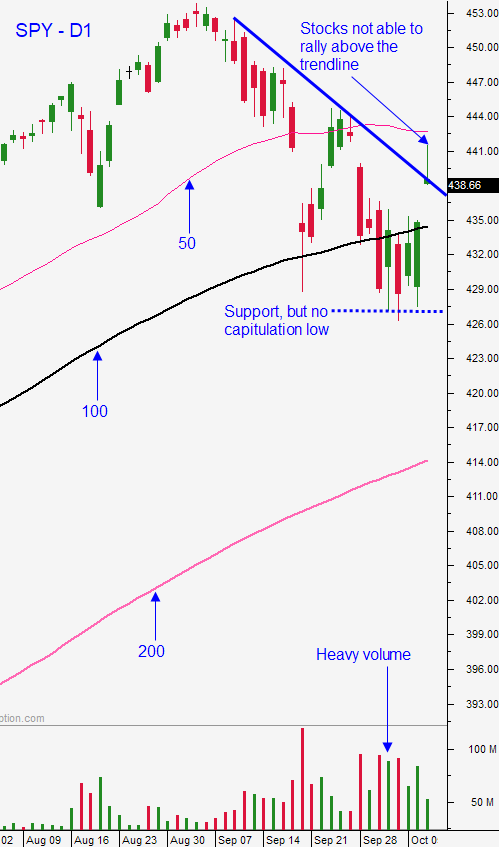
Posted 9:30 AM ET – The S&P 500 is at a critical juncture and it could make a big move in either direction. Use the downward sloping trend line on a daily chart at your guide on when to buy stocks. If the S&P 500 closes above it, look for a steady move higher. Use SPY $428 as your guide on the downside. If the market closes below that key support we are likely to test the 200-day MA and it will be time to short. Until then, day trade and stay flexible.
In September 194,000 jobs were created and that is well below the 500,000 that were expected. From a market perspective, “bad news could be viewed as good news” because it will encourage the Fed to stay “dovish”. From my perspective there is a component I watch closely and it is bearish. Hourly wages increased .6% and that is a relatively “hot” number. I have been expecting this and it is inflationary. There are 10 million unfilled jobs and employers are struggling to find workers. Wages are the highest input cost for companies and it will weigh on profit margins.
The second highest input cost for companies is energy. There is a global energy supply shortage. China is rationing electricity and India has a few days of coal supplies left. It takes months for production to increase and these higher input costs are going to put upward pressure on inflation as producers pass on higher costs to consumers.
China’s PMI’s were in contraction territory in September. China has a 10-month head start on the global Covid recovery and it could be a sign that global activity is starting to decelerate. Rising inflation and economic contraction are a lethal combination for stock prices. Credit issues in China are also surfacing and slowing economic activity will reveal the magnitude of the problem.
The FOMC minutes will be released Wednesday at 2 pm ET. Traders will be watching if for clues on how the Fed officials voted and it will provide clues on a taper timeline.
Earnings season will start this week and banks will dominate the early scene. With interest rates rising, the reaction should be positive. In general, the market bid is fairly strong heading into earnings season and support at SPY $428 should hold. If it is tested in October, that is a bearish warning sign longer term.
Swing traders with a 3-4 week time horizon should stay in cash. Don’t buy until the SPY closes above the downward sloping trend line on a daily chart. Don’t short until we close below SPY $428.
Day traders should stay very fluid. Expect two-sided price action and don’t get locked into a directional bias. I will spend the first 30-45 minutes getting my market bias. During that time I will find stocks with relative strength and relative weakness. I want technical breakdowns and heavy volume for my candidates and I will be ready to trade in either direction.
Support is at SPY $428 Resistance is at $439.90 and $441.60.
.
.


Daily Bulletin Continues...

