A “V” bottom gets its name from the chart pattern it leaves behind. The formation occurs when a strong upside trend has formed and the market over-extends itself. An event creates a panic and prices plunge as speculators bail. The move is fast and furious and once the selling abates, bargain hunters step in. The snap back rally is just as extreme as buyers and short sellers grab anything they can.
By my definition, you need to see at least a 10% drop from the high to even consider the potential for a “V” bottom. A drop of that magnitude is usually enough to scare out bullish speculators and to attract short sellers. It is also large enough to start generating margin calls. Remember, we are not talking about a gradual drift lower. The market hits an air pocket and it has many consecutive big declines. The issue with the “V” bottom is that you don’t know if the drop is the beginning of a trend reversal and you don’t know where it will ultimately find support.
The market tends to move in stages and each one is defined by a decline, a relative low and a bounce. I will describe my tactics by dividing the move into 4 legs. In the first leg, I’m simply managing risk and balancing my bias in case the drop is legitimate. The chart below uses an example from 1998.
.
.
.
.
Leg #1
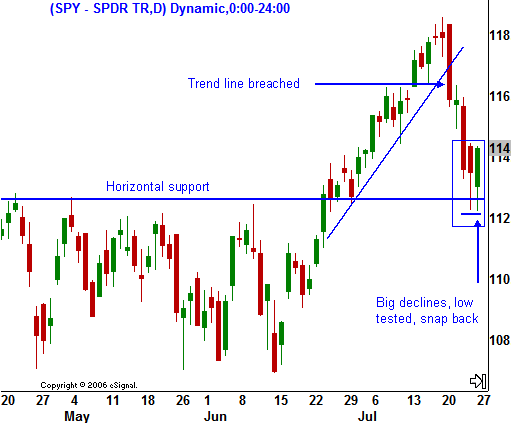
1. I always have a list of bearish stocks ready and I update the list daily. The first leg of the move lower will breach an up trend line or a minor horizontal support level.
2. I reduce my long positions and I buy puts on a few of the stocks that look weak. At a market top, the implied volatilities (IVs) are pretty low and the puts are relatively cheap.
3. If I have many longs to unwind and the move happens quickly, I might buy index puts (SPY, OEX, SPX) as an immediate hedge while I adjust.
4. At this stage I want to see a relative low and a test of that low.
5. If the low holds and the market rallies back through minor resistance, it was a head fake. In this case, the minor resistance would be 116, the low and the close of the first big down day. If the market tests the low and it fails, there will be a second leg to the decline.
During this first stage, I’m just exercising good risk management. I’m taking profit on my longs and adding a few put positions to reach a neutral bias. The move could be the start of something bigger or it could be a complete head fake.
Risk management and capital preservation are critical to successful trading. If this move is just a head fake, I will look like an over reacting idiot and the maneuver will probably cost me 5% in slippage, commissions and lost momentum. However, I’m hedged, I can think clearly and I’m mentally prepared if it is a bona fide decline.
Right now (March 19th), the market is in Leg #1 and I don’t know if this is the start of a bigger decline. If you trade long enough, you’ll find that much of your time is spent positioning and re-positioning. The profits come slowly and then everything lines up. I probably have 2-3 streaks each year that make my bottom line. In the next post, I will describe the second leg.