Understanding the nuances of candle patterns is crucial for informed technical analysis. A candlelight chart pattern provide traders with valuable insights into market trends and potential reversals. In this article, we will delve into the basics of candlesticks, explore their historical origins in Japan, compare them to bar charts, and analyze key candle patterns that traders often rely on for strategic decision-making.
As the financial markets evolve, the significance of candle patterns continues to grow. A candlelight chart pattern serves as a common language among traders, facilitating effective communication of market sentiment. Traders worldwide use candle patterns to interpret price movements and the collective psychology of the market. The ability to decipher these visual cues empowers traders to make well-informed decisions, adding a layer of sophistication to their trading strategies.
Table of Contents
Basic Components of Candle Patterns
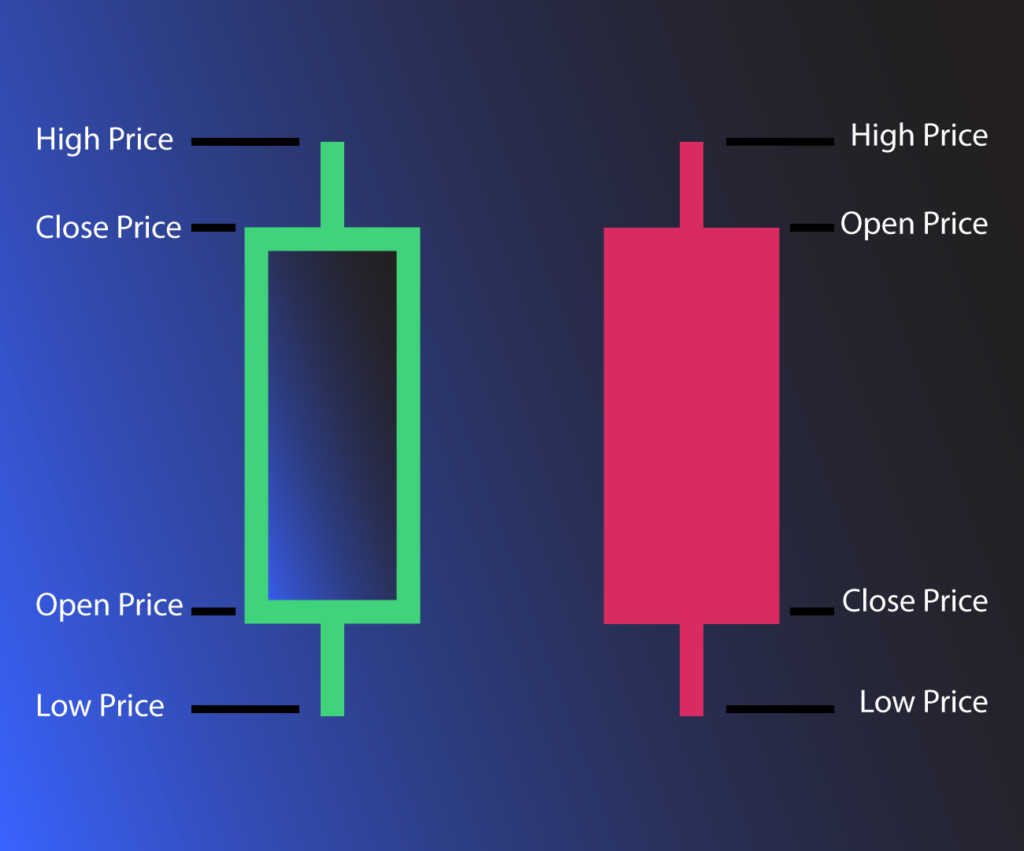
Candlestick charts are often favored over bar charts due to their visual clarity and the wealth of information they convey. While both types of charts display the same price information, candlestick charts present it in a more digestible and intuitive format. The body of the candlestick immediately communicates the direction of price movement, making it easier for traders to interpret and act upon market trends.
The open, high, low, and close are not just data points; they represent the ebb and flow of market dynamics. The length of the candle’s body and the presence or absence of a wick tell a story of buyer and seller interactions. Candlelight chart patterns provide a holistic view of market sentiment. Traders can gauge not only the intensity of price movements but also the level of conviction behind them. This nuanced understanding is a key factor that sets candlestick charts apart and elevates them as indispensable tools in the trader’s toolkit.
Differences Between Candlestick and Bar Charts
Candlestick charts are often favored over bar charts due to their visual clarity and the wealth of information they convey. While both types of charts display the same price information, candlestick charts present it in a more digestible and intuitive format. The body of the candlestick immediately communicates the direction of price movement, making it easier for traders to interpret and act upon market trends.
In technical analysis, the distinction between candlestick and bar charts extends beyond mere aesthetics. Candlestick charts, with their vivid representation of bullish and bearish movements, provide traders with a quick and intuitive way to assess market sentiment. The visual appeal of candlesticks goes hand in hand with their efficiency in conveying information, offering traders a comprehensive view of price action that might be less apparent in traditional bar charts.
Historical Roots: The Journey from Japan to Global Adoption
The history of candlestick charts can be traced back to 18th-century Japan, where rice traders used them to analyze market trends. The technique was later refined and popularized by the legendary Japanese rice trader, Munehisa Homma. Candlelight chart patterns eventually made their way to the Western world in the late 20th century, gaining widespread acceptance among traders and analysts for their effectiveness in predicting price movements.
The journey of candlestick charts from the rice markets of feudal Japan to the modern global financial landscape is not just a historical footnote; it’s a testament to the enduring principles they embody. Munehisa Homma’s pioneering work laid the foundation for a visual language that transcends cultural and geographical boundaries. The adoption of candlestick charts by Western traders signifies a recognition of the universal truths embedded in market dynamics. This cross-cultural acceptance is a reminder that, at its core, trading is a human endeavor influenced by emotions and behaviors that are timeless.
Interested In Learning More?
Exploring Basic Candle Patterns:
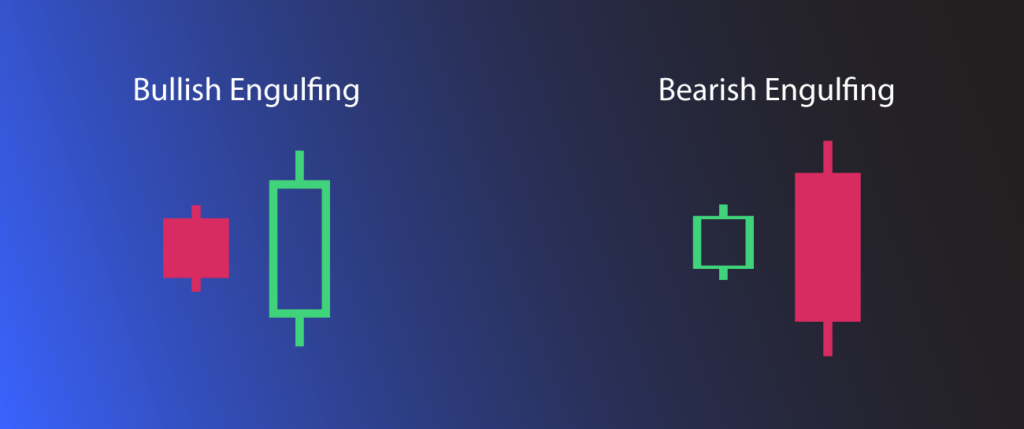
Bearish & Bullish Engulfing Patterns
- Bullish Engulfing: This pattern occurs when a small bearish candle is followed by a larger bullish candle that completely engulfs the previous one, signaling a potential bullish reversal.
- Bearish Engulfing: Conversely, a Bearish Engulfing pattern suggests a potential bearish reversal, with a large bearish candle overshadowing the previous bullish one.
While these candle patterns serve as potent signals for bullish or bearish direction, understanding the broader context is crucial. Traders often look for these patterns at key support or resistance levels to enhance their predictive power. The engulfing patterns gain additional significance when accompanied by other technical indicators or when aligning with broader market trends. This nuanced approach allows traders to filter signals and refine their decision-making process, emphasizing the importance of context in the interpretation of candle patterns.
Bearish Evening Star
- The Bearish Evening Star consists of three candles – a large bullish candle, followed by a small bullish or bearish candle, and finally a large bearish candle. This signals a potential trend reversal to the downside.
- Of course, a Bullish counterpart is possible.
The three-candle structure of the Bearish Evening Star encapsulates a transition in market sentiment. As the bullish momentum loses steam, the small indecisive candle acts as a harbinger of change. When the subsequent large bearish candle takes charge, it can confirm the shift in sentiment while also providing traders with a clear entry point. Recognizing the narrative told by the three candles equips traders with the foresight needed to adapt to changing market conditions.
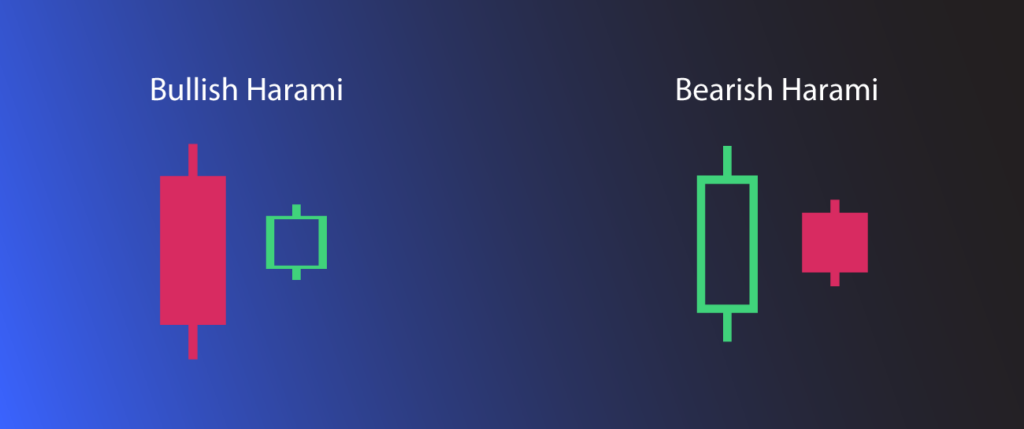
Bearish & Bullish Harami
- Bullish Harami: A Bullish Harami pattern involves a small bearish candle within the body of a larger bearish candle. It indicates a potential bullish reversal.
- Bearish Harami: Conversely, a Bearish Harami pattern occurs when a small bullish candle is engulfed by a larger bearish candle, signaling a potential bearish reversal.
The Harami patterns, with their implications of market indecision and potential reversals, come to life when considered in the broader trend context. Bullish Harami within a prevailing downtrend may signify a pause in bearish momentum rather than an outright reversal. Similarly, a Bearish Harami in an uptrend prompts traders to exercise caution rather than rushing to short positions. Understanding the interplay between these candle patterns and overarching market trends is essential for traders seeking to extract maximum value from the signals they provide.
Interested In Learning More?
Bearish & Bullish Harami Cross
- Bullish Harami Cross: This pattern is similar to the Bullish Harami but involves a doji candle in the second position, indicating indecision in the market.
- Bearish Harami Cross: The Bearish Harami Cross is the bearish counterpart, suggesting potential bearish reversal.
The inclusion of a doji candle in the Harami Cross patterns introduces an element of uncertainty into the equation. Traders often interpret the doji as a manifestation of market indecision, emphasizing the need for confirmation in subsequent price action. This cautious approach aligns with the principle of not relying solely on candlestick patterns but integrating them into a comprehensive analysis that considers multiple factors. The Harami Cross patterns, with their doji-induced ambiguity, underscore the importance of patience and confirmation in the decision-making process.
Bullish Rising Three
- The Bullish Rising Three is a bullish continuation pattern that occurs after an uptrend. It consists of a long bullish candle followed by three small bearish candles and concluded with another bullish candle.
The narrative of the Bullish Rising Three extends beyond its immediate bullish signal. This pattern, occurring within the context of an existing uptrend, reflects a temporary pause in bullish momentum rather than a reversal. The three small bearish candles signify a brief period of consolidation before the prevailing uptrend reasserts itself. Traders leveraging the Bullish Rising Three as a continuation candlelight chart pattern are not merely responding to a single signal but are attuned to the ongoing dynamics of the market, demonstrating the importance of considering candle patterns within the broader trend.
Bearish Falling Three
- The Bearish Falling Three is a bearish continuation pattern that unfolds after a downtrend. It comprises a long bearish candle followed by three small bullish candles and closes with another bearish candle.
Similar to its bullish counterpart, the Bearish Falling Three unfolds within the context of a prevailing downtrend. The pattern signifies a brief respite in the bearish momentum rather than a complete reversal. The three small bullish candles within the formation highlight a temporary pause in selling pressure. Traders interpreting the Bearish Falling Three as a continuation candlelight chart pattern understand that these brief periods of consolidation are part of the natural ebb and flow of market dynamics, reinforcing the importance of aligning pattern analysis with the broader trend.
Why Candle Patterns Work
Candle patterns are effective because traders across the globe use them as a visual representation of market sentiment. The psychological aspects of trading are reflected in these patterns, providing traders with insights into the ongoing battle between bulls and bears. The widespread adoption of candlestick analysis has led to a self-fulfilling prophecy, where the candle patterns are recognized and acted upon by a significant number of market participants.
Conclusion
The effectiveness of candle patterns lies in their ability to tap into the collective psyche of the market. Traders, driven by a combination of fear, greed, and herd mentality, leave imprints on price charts that manifest as recognizable patterns. As these patterns become ingrained in the trader’s toolkit, they evolve into self-fulfilling prophecies. The patterns work not merely due to their inherent predictive power but because traders, collectively, assign significance to them. This symbiotic relationship between market participants and candle patterns underscores the importance of understanding not just the candle patterns themselves but the psychology that underpins all technical analysis.