Daily Market Analysis
2024-04-08
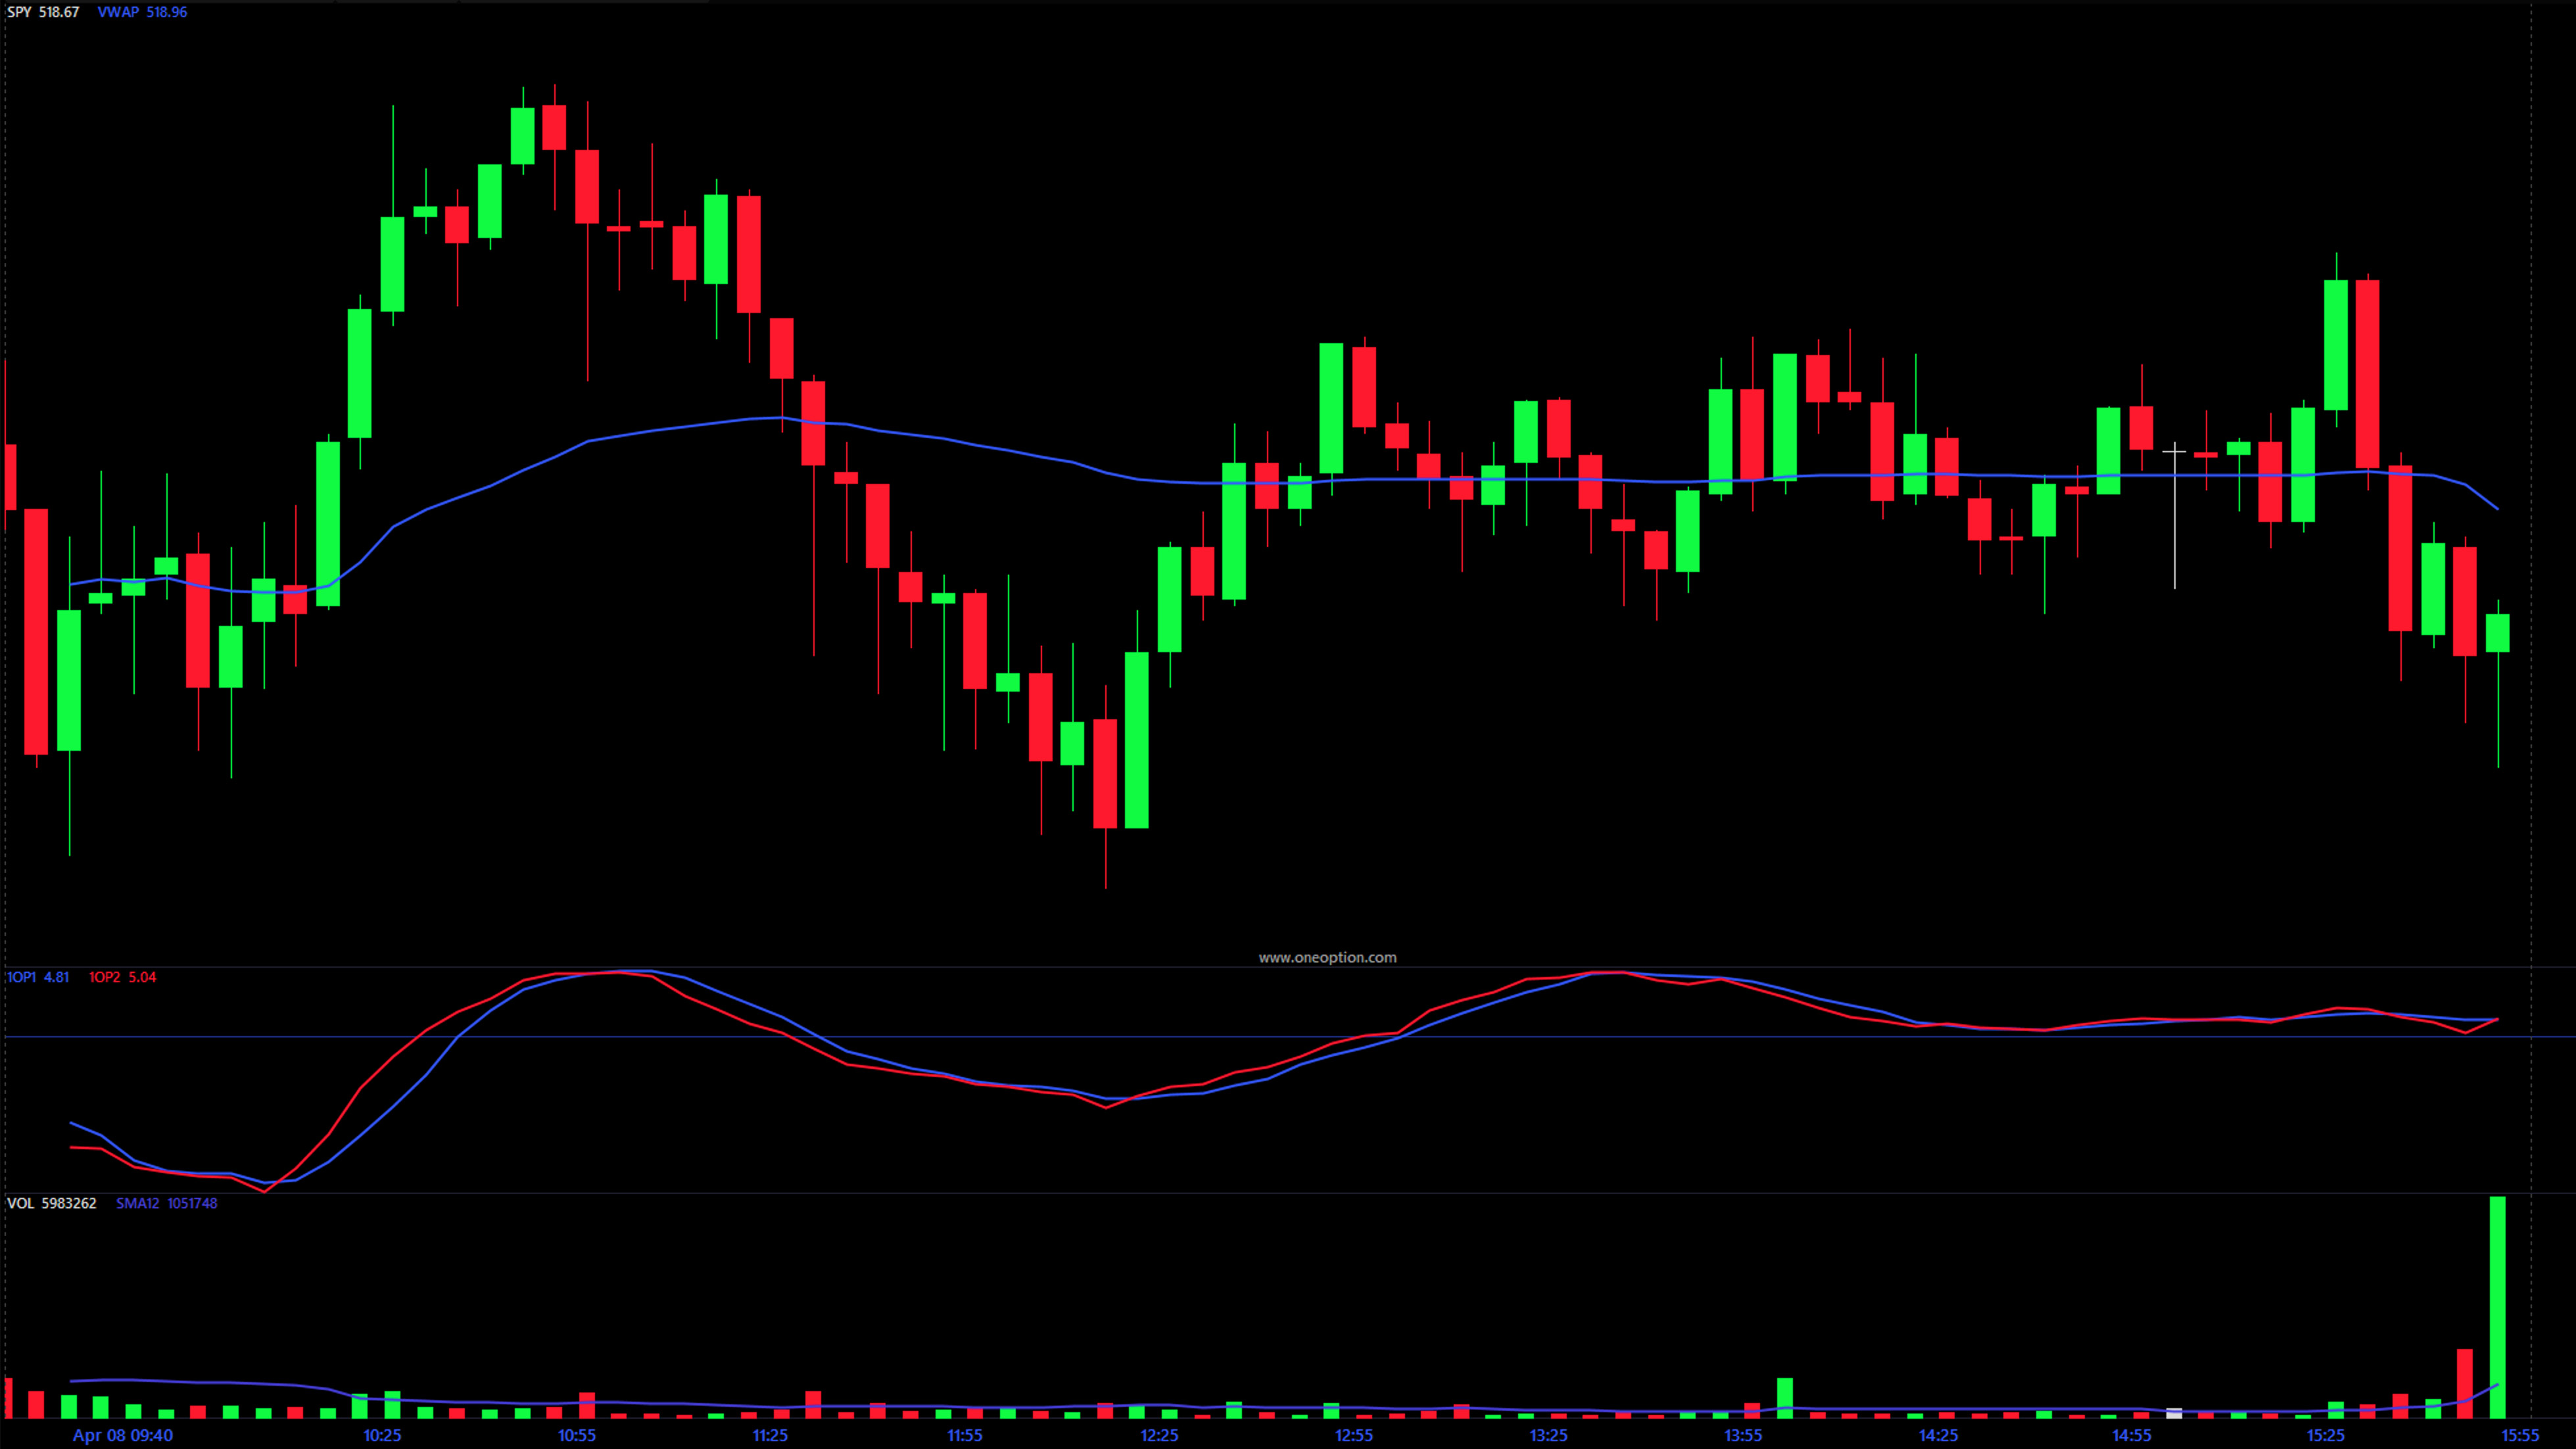
Review our intraday commentary to learn how we interpret price action and build a market narrative.
Drag the blue slider to reveal the day's price action. Dots on the timeline represent comments and can be clicked. View the table below for all market-related comments and annotated charts (including those from after hours).

Abbreviated Comments View all
Click to expand content and reposition slider.
| 09:44:39 Pete |
When you are looking at D1 charts, almost every stock will have a long red candle from Thursday. Stocks with great relative strength will have recovered most of that red candle (if not all of it). Stocks that did not... |
|---|---|
| 09:55:50 Pete |
Look at the D1 of MSFT. Do you see how it is above the open from the red candle Thurs? That is a sign of strength. This is the type of pattern you should be looking for. On the market... |
| 09:57:43 Pete |
Look at the chart of AMD. See how the stock barely rallied Fri and how it is at the low of the red bar from Thurs? That stock is weak and it has not been able to recover. The red... |
| 10:03:30 Pete |
We don't know how this is going to play out, but if the market struggles to get thru the all-time high during earnings season, it will be a sign of resistance. In the last 5 months, novice traders should not... |
| 11:15:57 Pete |
Sloppy start to the week and SPY not able to get thru the high from Fri. Bearish cross. I would hold off on longs until this bear cycle runs. Volume is light today and not much going on. We could... |
Limited Access Only
Become a OneOption member to view all Daily Market Comments. Please visit our Start Here page to learn more about our system and how to become a member via our Free Trial.
Start Free Trial