In today’s option trading blog, we’ll take another step. At this stage of my daily routine, I’ve drilled down from 20,000+ stocks to about 10 bullish and 10 bearish candidates. So far, my search has simply looked at the stock’s technicals. Now, it’s time to “lift up the hood” and see what’s making it tick.
Fundamental analysis will get me familiar with the company. I can judge the character of the move and draw conclusions. I don’t even pretend that I’ll pick the perfect entry or exit and that’s why I scale in/out. Often, I’ll enter a position prematurely. When the position moves against me, it is this part of my analysis that gives me “staying power”. I’ve done my homework and I know why the trade makes sense. I divide my research into three basic categories: news, financial statements, macro environment. Momentum stocks tend to be surrounded by news and that’s where I start.
My news search starts with the date of the biggest price movement. I want to digest that piece of information. Some news I discount and I consider the move to be “fake”. Brokerage upgrades/downgrades and the rebroadcast of old news falls into that category. These reactionary moves tend to be temporary. Call it the skeptic in me, but brokerage firms carry inventories of stock and they’ll say anything to protect their investments. Ever notice that proprietary trading comprises a big portion of their income? I don’t have the exact statistics, but during my graduate studies I recall research that showed that stocks have a 3% counter move after a brokerage firm upgrade/downgrade. This research measured the price 30 days from the release and it was conducted over a 50 year time span.
Earnings announcements, guidance revisions and new contracts are what I value. They impact the bottom line and are material. Once I’ve looked at the current news items, I go back to the last earnings announcement and I scan for the company’s own press release. It’s usually carried by AP (Associated Press) or BW (Business Wire). This is my chance to hear about the current business environment. Sarbanes-Oxley has forced CEOs to “come clean” and I have a window of opportunity to get a good look at what is happening inside the company. Once I’ve read their statements, I stay in that 2-day period and I look for third-party articles that have been written. I like to compare my perspectives with those of other analysts.
For longs I want to see improvement in revenues and margins and I want future guidance to be robust. The comments from the CEO/CFO should be optimistic rather than guarded. The opposite would be true for shorts.
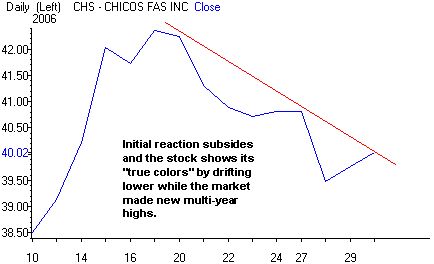
I don’t like to trade the actual news release. I have found that there is too much “noise” and the momentum players have the stock flying all over the place. It is easy to get whip-sawed out of a good position during volatile swings. Once the event has passed (3-4 days later) the stock settles into a trading pattern and it starts to show its “true colors”. If I have a burning desire to trade a major news event, I will take a very small position knowing that either way, the outcome will have a minimal impact on my P&L.
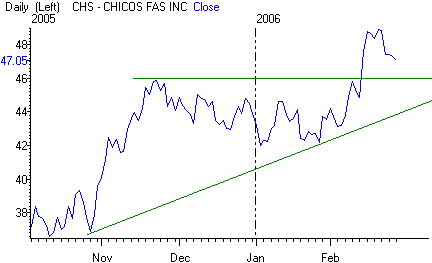
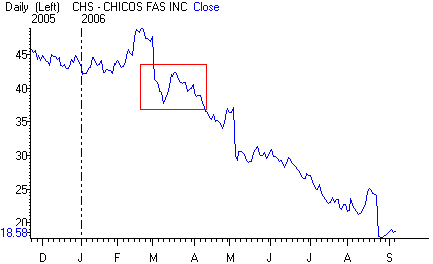
This example is a favorite because it clearly demonstrates the points above. The first chart shows a strong stock in an up trend. It is Chicos FAS – a “street” favorite.
The next chart shows what happens to a high P/E company that misses EPS estimates by a penny. The company lowered guidance and said that profit margins would decrease by 1%. The stock took out horizontal support at $46 and $42.
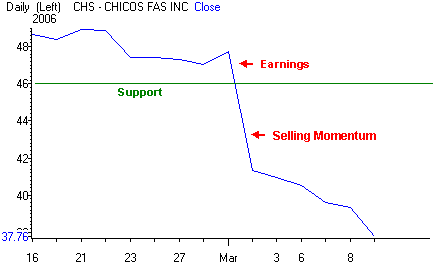
In a matter of days, the stock dropped from $48 to $38. Not to worry, the analysts would save the day and reiterate their buy ratings. They posted press releases and told everyone what a great buying opportunity this was. After all, they were still standing behind their “buy rating” and keeping their price target of $54. In reality, the shorts got scared and covered, bargain hunters “scooped the stock” and the brokerage firms lightened their inventory of CHS.
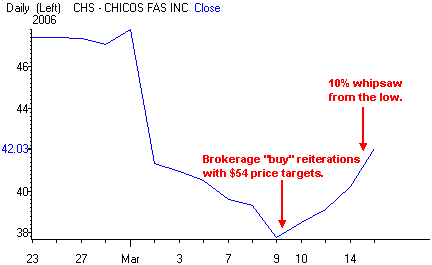
The next chart shows that the bounce failed and the momentum players (shorts) were shaken out. It was just a matter of time until the sellers applied enough pressure to exhaust the buyers. At this point, the “dust had settled” and the true weakness started to show itself.
The final chart shows the rest of the story. If you liked it at $40 you have to love it at $20 – right?
This is a link to my initial commentary on the trade. I archive all of my Daily Reports so that subscribers can go back and review the research. Please use the drop down menu labeled Past Reports and go to the date: 3/09/06. Scroll to the bottom of the screen to view CHS.
The take-a-way is this, I look for material news events and I try not to get caught up in the initial chaos. Once the dust has settled, I get a feel for the real demand/supply and I determine if there is an opportunity.
The financial statements were also a factor in the CHS trade. In my next posting, I’ll cover that topic and I’ll use a different example.
If you’ve had a similar experience with a brokerage upgrade/downgrade being on the wrong side of a trade, post a comment and share your example. I love the irony